© 2020 SCSglobalServices.com Environmental Product Declaration Ecore International Declaration Owner Ecore International 715 Fountain Avenue Lancaster, PA 17601 main +717.295.3400 | fax +800.322.1923 | www.ecoreintl.com Product Rubber Flooring: PlayGuard; ECOsmash/SmashTile; ECOsurfaces; ECOfit/Motivate, ECOfit Plus/Rally, Beast, Monster; Everlast Basic/ECOnights; UltraTile/ECOmax; QT/ECOsilence EPD represents delivery of product to customers globally. Functional Unit The functional unit is one square meter of flooring over a 75-year period EPD Number and Period of Validity SCS-EPD-06146 EPD Valid May 20, 2020 through May 19, 2025 Product Category Rule PCR Guidance for Building-Related Products and Services Part A: Life Cycle Assessment Calculation Rules and Report Requirements. Version 3.2. UL Environment. Sept. 2018 PCR Guidance for Building-Related Products and Services Part B: Flooring EPD Requirements. Version 2. UL Environment. May 2018. Program Operator SCS Global Services 2000 Powell Street, Ste. 600, Emeryville, CA 94608 +1.510.452.8000 | www.SCSglobalServices.com
Environmental Product Declaration Ecore International ………………………………………………………………………………………………..………………………………………………………………………………………… 1 Declaration Owner: Ecore International Address: 715 Fountain Avenue, Lancaster, PA 17601, United States Declaration Number: SCS-EPD-06146 Declaration Validity Period: May 20, 2020 through May 19, 2025 Program Operator: SCS Global Services Declaration URL Link: https://www.scsglobalservices.com/certified-green-products-guide LCA Practitioner: Gerard Mansell, Ph.D., SCS Global Services LCA Software and LCI database: OpenLCA 1.7 software and the Ecoinvent v3.6 database Product RSL: Various Markets of Applicability: Global EPD Type: Product-Specific EPD Scope: Cradle-to-Grave LCIA Method and Version: CML-IA and TRACI 2.1 Independent critical review of the LCA and data, according to ISO 14044 and ISO 14071 ☐ internal ☒ external LCA Reviewer: Thomas Gloria, Ph.D., Industrial Ecology Consultants Part A Product Category Rule: PCR Guidance for Building-Related Products and Services Part A: Life Cycle Assessment Calculation Rules and Report Requirements. Version 3.2. UL Environment. Sept. 2018 Part A PCR Review conducted by: Lindita Bushi, PhD (Chair); Hugues Imbeault-Tétreault, ing., M.Sc.A.; Jack Geibig Part B Product Category Rule: PCR Guidance for Building-Related Products and Services Part B: Flooring EPD Requirements. Version 2. UL Environment. May 2018. Part B PCR Review conducted by: Jack Geibig (chair), Ecoform; Thomas Gloria, Industrial Ecology Consultants; Thaddeus Owen Independent verification of the declaration and data, according to ISO 14025 and the PCR ☐ internal ☒ external EPD Verifier: Thomas Gloria, Ph.D., Industrial Ecology Consultants Declaration Contents: 1. Ecore International ............................................................................................. 2 2. Product .................................................................................................................. 2 3. LCA: Calculation Rules ........................................................................................ 9 4. LCA: Scenarios and Additional Technical Information.............................. 15 5. LCA: Results ........................................................................................................ 19 6. LCA: Interpretation ........................................................................................... 52 7. Additional Environmental Information........................................................ 55 8. References .......................................................................................................... 56 Disclaimers: This EPD conforms to ISO 14025, 14040, 14044, and ISO 21930. Scope of Results Reported: The PCR requirements limit the scope of the LCA metrics such that the results exclude environmental and social performance benchmarks and thresholds, and exclude impacts from the depletion of natural resources, land use ecological impacts, ocean impacts related to greenhouse gas emissions, risks from hazardous wastes and impacts linked to hazardous chemical emissions. Accuracy of Results: Due to PCR constraints, this EPD provides estimations of potential impacts that are inherently limited in terms of accuracy. Comparability: The PCR this EPD was based on was not written to support comparative assertions. EPDs based on different PCRs, or different calculation models, may not be comparable. When attempting to compare EPDs or life cycle impacts of products from different companies, the user should be aware of the uncertainty in the final results, due to and not limited to, the practitioner’s assumptions, the source of the data used in the study, and the specifics of the product modeled. In accordance with ISO 21930:2017, EPDs are comparable only if they comply with the core PCR, use the same sub-category PCR where applicable, include all relevant information modules and are based on equivalent scenarios with respect to the context of construction works.
Environmental Product Declaration Ecore International ………………………………………………………………………………………………..………………………………………………………………………………………………………………… 2 © 2020 SCSglobalServices.com 1. Ecore International From the weight room to the recovery room, Ecore empowers human performance with safe, quiet and ergonomic flooring. Our team is driven by the question: can a floor do more? For Ecore, the answer is “yes.” We design and manufacture pro-performance surfaces engineered to help energize the people above them. Built on a legacy that began in 1871, our team designs innovative solutions for many industries, including healthcare, hospitality, wellness, sports, and fitness. Ecore, headquartered in Lancaster, PA, serves athletic and commercial flooring customers in more than 75 countries. 2. Product 2.1 PRODUCT DESCRIPTION Product Line Product Name Product Description PlayGuard PlayGuard - 2.5"/ECOmax 2.5"; High color; PlayGuard - 2.5"/ECOmax 2.5"; Low color PlayGuard playground tiles are designed exclusively to reduce the risk of serious injury associated with falls from playground equipment. It features easy installation and maintenance, bold color choices, and the industry’s only 15-year warranty. In addition to playground application, PlayGuard can be used for rooftops and patios. ECOsmash/ SmashTile ECOmash/SmashTile -High color; ECOmash/SmashTile -Low color SmashTile/ECOsmash mitigates the shock and sound resulting from weights being released onto its surface by absorbing impact with its 2-foot by 2-foot by 2.5-inch molded tile. SmashTile/ECOsmash is the perfect complement to platform style weightlifting. ECOsurfaces ECOsurfaces - High color; ECOsurfaces - Low color ECOsurfaces is a distinctive vulcanized composition rubber surface. Available in traditional rolls and tiles, this resilient 3.2mm thick surface has beauty and brains! ECOsurfaces also has all the durability and ease of maintenance associated with a hard surface. Versatile, durable, and sustainable, ECOsurfaces has been a staple in the commercial flooring market for more than 30 years. ECOfit/ Motivate, ECOfit Plus/ Rally, Beast, Monster Beast 2.5mm +8mm; Monster 2.5mm +8mm/12mm; ECOfit/Motivate 3mm+5mm; ECOfit Plus/Rally- 3mm+12mm The Performance family of products (Motivate, Rally, Beast, Monster) is tailored for strength and conditioning. These dual durometers systems are engineered to absorb the impact force related to aggressive functional training, providing an ergonomically advanced surface that works in concert with the body. ECOfit is designed for bodies in motion. This 8.2mm engineered floor provides enhanced performance, while mitigating fatigue and the risk of injury. By utilizing Ecore's patented itstru technology, a standard ECOsurfaces 3.2mm surface layer is fusion-bonded to a 5mm composition rubber backing. ECOfit Plus offers a prescription for comfort. Whether a traditional health and fitness application or an active work environment, ECOfit Plus provides enhanced performance while mitigating fatigue. The key is the dynamic energy return that forces the user to stay off their heels and on the balls of their feet. ECOfit Plus is available in both 15.2mm glue down rolls and adhesive-free interlocking tiles. Everlast Basic/ ECOnights Everlast Basic/ ECOnights - High color; Everlast Basic/ ECOnights - Low color ECOnights/Basic Rolls and Tiles are the “original” composition rubber fitness floor. Available in rolls and tiles, this durable surface sets the standard for performance, quality, and affordability. UltraTile/ ECOmax UltraTile/ECOmax 1"- High color; UltraTile/ECOmax 1" Low color UltraTile/ECOmax is a rubber floor tile designed with a patented “ultra” high-density wear layer on a molded base. This 24-by-24-by-1-inch modular tile offers enhanced shock absorption against impact in moderate to extreme weight drop applications. QT/ ECOsilence QT/ECOsilence – SCU; QT/ECOsilence - RBM QT/ECOsilence sound control underlayment (scu) is a flat, resilient rubber underlayment used directly under most floor finishes, yielding exceptional results even under hard surface flooring and over concrete and wood joist construction. QT resilient base mat (rbm) is a dimpled, resilient base mat that can be applied under gypsum or full weight concrete to produce some of the thinnest sound rated systems in the industry.
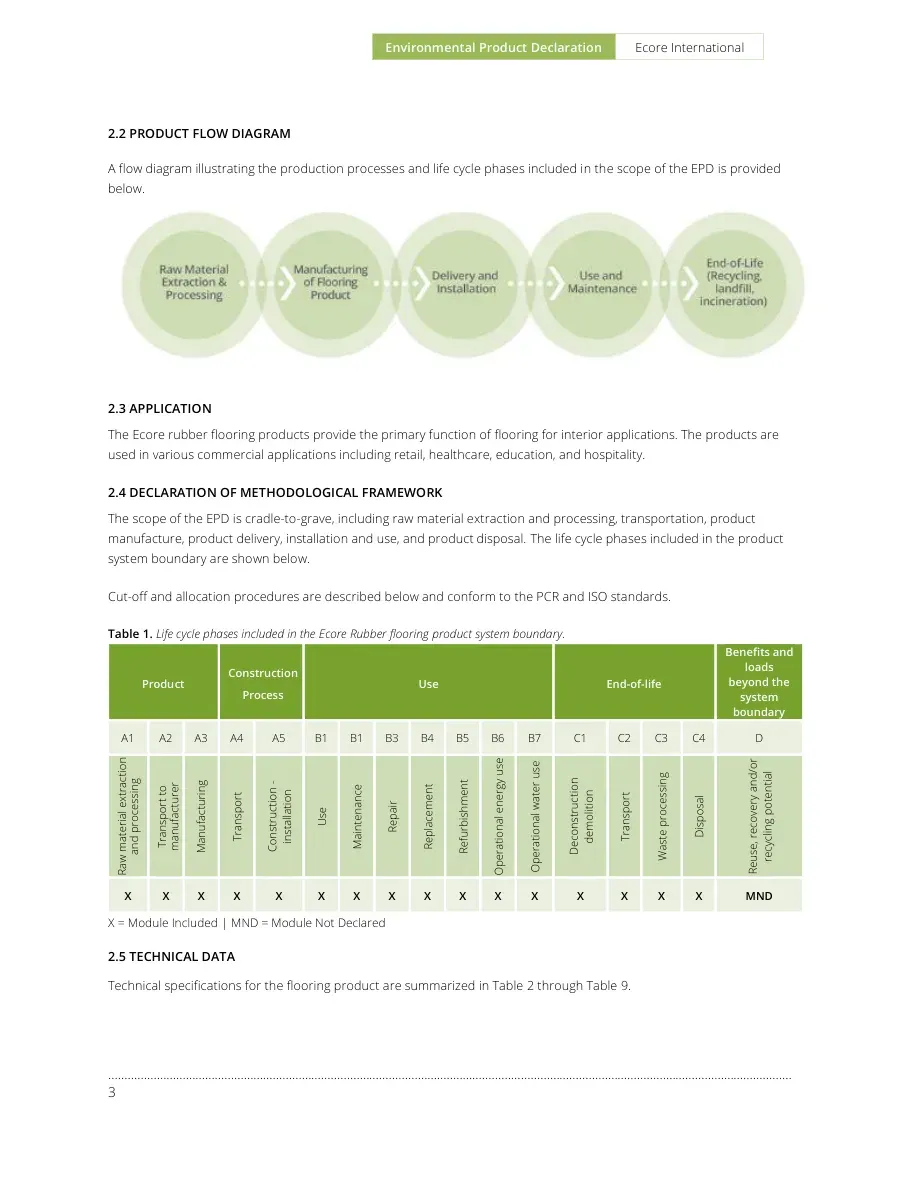
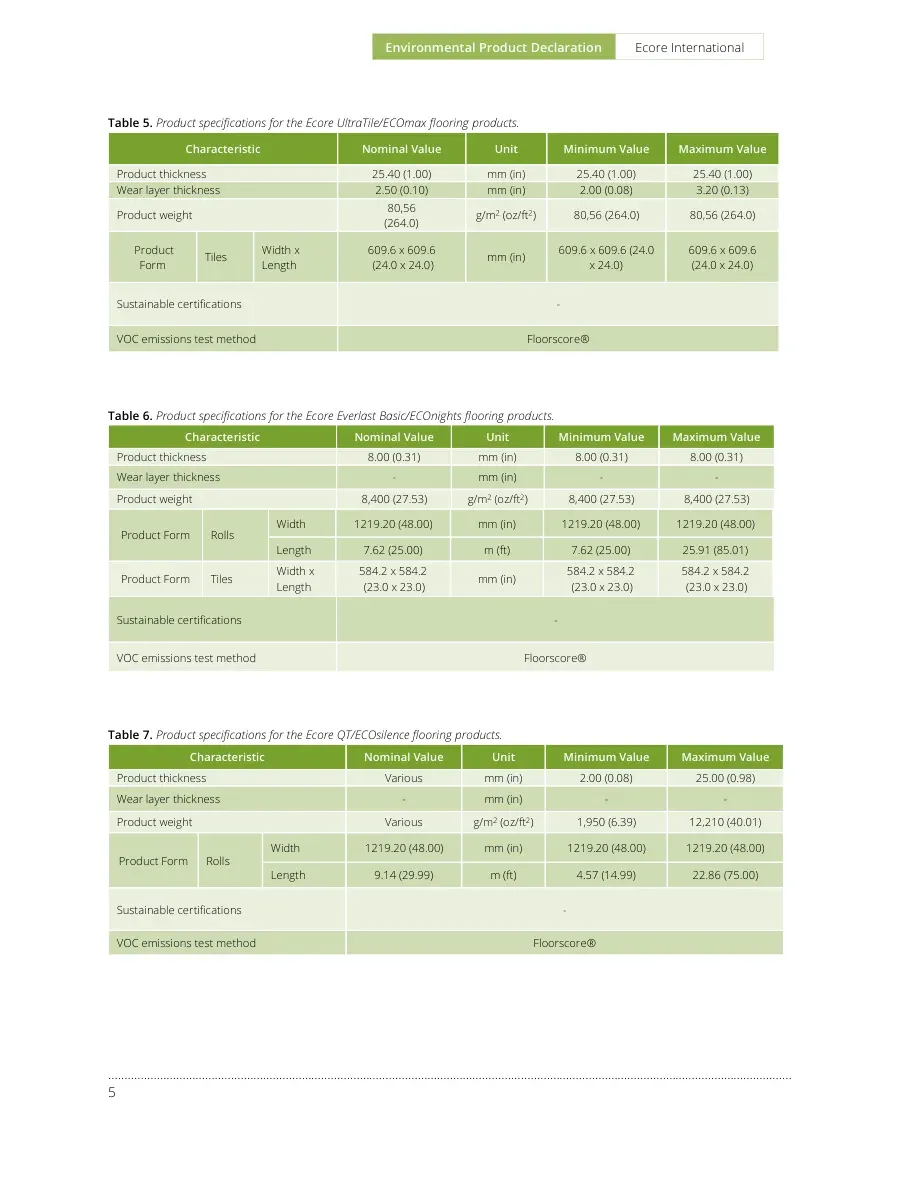
Environmental Product Declaration Ecore International ………………………………………………………………………………………………..………………………………………………………………………………………… 3 2.2 PRODUCT FLOW DIAGRAM A flow diagram illustrating the production processes and life cycle phases included in the scope of the EPD is provided below. 2.3 APPLICATION The Ecore rubber flooring products provide the primary function of flooring for interior applications. The products are used in various commercial applications including retail, healthcare, education, and hospitality. 2.4 DECLARATION OF METHODOLOGICAL FRAMEWORK The scope of the EPD is cradle-to-grave, including raw material extraction and processing, transportation, product manufacture, product delivery, installation and use, and product disposal. The life cycle phases included in the product system boundary are shown below. Cut-off and allocation procedures are described below and conform to the PCR and ISO standards. Table 1. Life cycle phases included in the Ecore Rubber flooring product system boundary. Product Construction Process Use End-of-life Benefits and loads beyond the system boundary A1 A2 A3 A4 A5 B1 B1 B3 B4 B5 B6 B7 C1 C2 C3 C4 D Raw material extraction and processing Transport to manufacturer Manufacturing Transport Construction - installation Use Maintenance Repair Replacement Refurbishment Operational energy use Operational water use Deconstruction demolition Transport Waste processing Disposal Reuse, recovery and/or recycling potential X X X X X X X X X X X X X X X X MND X = Module Included | MND = Module Not Declared 2.5 TECHNICAL DATA Technical specifications for the flooring product are summarized in Table 2 through Table 9.
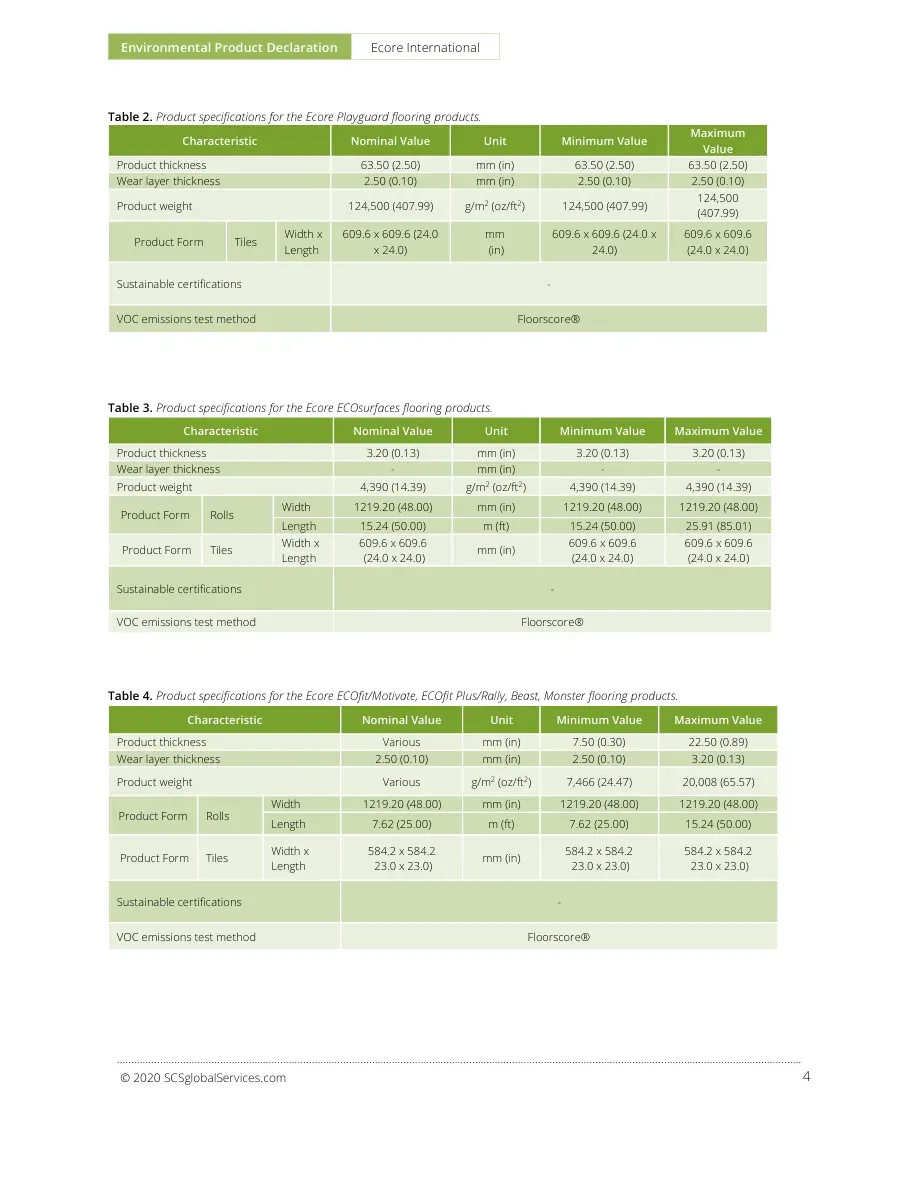
Environmental Product Declaration Ecore International ………………………………………………………………………………………………..………………………………………………………………………………………………………………… 4 © 2020 SCSglobalServices.com Table 2. Product specifications for the Ecore Playguard flooring products. Characteristic Nominal Value Unit Minimum Value Maximum Value Product thickness 63.50 (2.50) mm (in) 63.50 (2.50) 63.50 (2.50) Wear layer thickness 2.50 (0.10) mm (in) 2.50 (0.10) 2.50 (0.10) Product weight 124,500 (407.99) g/m2 (oz/ft2) 124,500 (407.99) 124,500 (407.99) Product Form Tiles Width x Length 609.6 x 609.6 (24.0 x 24.0) mm (in) 609.6 x 609.6 (24.0 x 24.0) 609.6 x 609.6 (24.0 x 24.0) Sustainable certifications - VOC emissions test method Floorscore® Table 3. Product specifications for the Ecore ECOsurfaces flooring products. Characteristic Nominal Value Unit Minimum Value Maximum Value Product thickness 3.20 (0.13) mm (in) 3.20 (0.13) 3.20 (0.13) Wear layer thickness - mm (in) - - Product weight 4,390 (14.39) g/m2 (oz/ft2) 4,390 (14.39) 4,390 (14.39) Product Form Rolls Width 1219.20 (48.00) mm (in) 1219.20 (48.00) 1219.20 (48.00) Length 15.24 (50.00) m (ft) 15.24 (50.00) 25.91 (85.01) Product Form Tiles Width x Length 609.6 x 609.6 (24.0 x 24.0) mm (in) 609.6 x 609.6 (24.0 x 24.0) 609.6 x 609.6 (24.0 x 24.0) Sustainable certifications - VOC emissions test method Floorscore® Table 4. Product specifications for the Ecore ECOfit/Motivate, ECOfit Plus/Rally, Beast, Monster flooring products. Characteristic Nominal Value Unit Minimum Value Maximum Value Product thickness Various mm (in) 7.50 (0.30) 22.50 (0.89) Wear layer thickness 2.50 (0.10) mm (in) 2.50 (0.10) 3.20 (0.13) Product weight Various g/m2 (oz/ft2) 7,466 (24.47) 20,008 (65.57) Product Form Rolls Width 1219.20 (48.00) mm (in) 1219.20 (48.00) 1219.20 (48.00) Length 7.62 (25.00) m (ft) 7.62 (25.00) 15.24 (50.00) Product Form Tiles Width x Length 584.2 x 584.2 23.0 x 23.0) mm (in) 584.2 x 584.2 23.0 x 23.0) 584.2 x 584.2 23.0 x 23.0) Sustainable certifications - VOC emissions test method Floorscore®
Environmental Product Declaration Ecore International ………………………………………………………………………………………………..………………………………………………………………………………………… 5 Table 5. Product specifications for the Ecore UltraTile/ECOmax flooring products. Characteristic Nominal Value Unit Minimum Value Maximum Value Product thickness 25.40 (1.00) mm (in) 25.40 (1.00) 25.40 (1.00) Wear layer thickness 2.50 (0.10) mm (in) 2.00 (0.08) 3.20 (0.13) Product weight 80,56 (264.0) g/m2 (oz/ft2) 80,56 (264.0) 80,56 (264.0) Product Form Tiles Width x Length 609.6 x 609.6 (24.0 x 24.0) mm (in) 609.6 x 609.6 (24.0 x 24.0) 609.6 x 609.6 (24.0 x 24.0) Sustainable certifications - VOC emissions test method Floorscore® Table 6. Product specifications for the Ecore Everlast Basic/ECOnights flooring products. Characteristic Nominal Value Unit Minimum Value Maximum Value Product thickness 8.00 (0.31) mm (in) 8.00 (0.31) 8.00 (0.31) Wear layer thickness - mm (in) - - Product weight 8,400 (27.53) g/m2 (oz/ft2) 8,400 (27.53) 8,400 (27.53) Product Form Rolls Width 1219.20 (48.00) mm (in) 1219.20 (48.00) 1219.20 (48.00) Length 7.62 (25.00) m (ft) 7.62 (25.00) 25.91 (85.01) Product Form Tiles Width x Length 584.2 x 584.2 (23.0 x 23.0) mm (in) 584.2 x 584.2 (23.0 x 23.0) 584.2 x 584.2 (23.0 x 23.0) Sustainable certifications - VOC emissions test method Floorscore® Table 7. Product specifications for the Ecore QT/ECOsilence flooring products. Characteristic Nominal Value Unit Minimum Value Maximum Value Product thickness Various mm (in) 2.00 (0.08) 25.00 (0.98) Wear layer thickness - mm (in) - - Product weight Various g/m2 (oz/ft2) 1,950 (6.39) 12,210 (40.01) Product Form Rolls Width 1219.20 (48.00) mm (in) 1219.20 (48.00) 1219.20 (48.00) Length 9.14 (29.99) m (ft) 4.57 (14.99) 22.86 (75.00) Sustainable certifications - VOC emissions test method Floorscore®
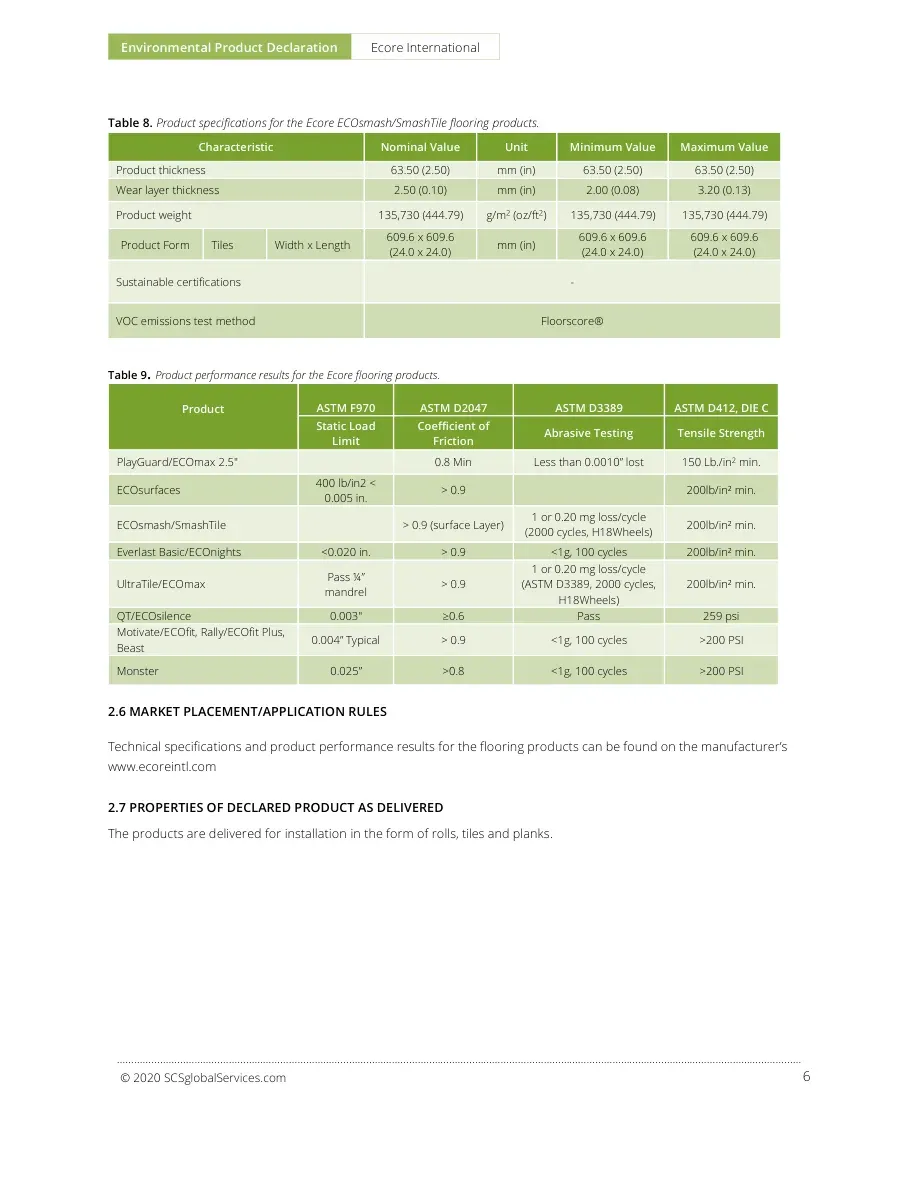
Environmental Product Declaration Ecore International ………………………………………………………………………………………………..………………………………………………………………………………………………………………… 6 © 2020 SCSglobalServices.com Table 8. Product specifications for the Ecore ECOsmash/SmashTile flooring products. Characteristic Nominal Value Unit Minimum Value Maximum Value Product thickness 63.50 (2.50) mm (in) 63.50 (2.50) 63.50 (2.50) Wear layer thickness 2.50 (0.10) mm (in) 2.00 (0.08) 3.20 (0.13) Product weight 135,730 (444.79) g/m2 (oz/ft2) 135,730 (444.79) 135,730 (444.79) Product Form Tiles Width x Length 609.6 x 609.6 (24.0 x 24.0) mm (in) 609.6 x 609.6 (24.0 x 24.0) 609.6 x 609.6 (24.0 x 24.0) Sustainable certifications - VOC emissions test method Floorscore® Table 9. Product performance results for the Ecore flooring products. Product ASTM F970 ASTM D2047 ASTM D3389 ASTM D412, DIE C Static Load Limit Coefficient of Friction Abrasive Testing Tensile Strength PlayGuard/ECOmax 2.5" 0.8 Min Less than 0.0010” lost 150 Lb./in2 min. ECOsurfaces 400 lb/in2 < 0.005 in. > 0.9 200lb/in² min. ECOsmash/SmashTile > 0.9 (surface Layer) 1 or 0.20 mg loss/cycle (2000 cycles, H18Wheels) 200lb/in² min. Everlast Basic/ECOnights <0.020 in. > 0.9 <1g, 100 cycles 200lb/in² min. UltraTile/ECOmax Pass ¼” mandrel > 0.9 1 or 0.20 mg loss/cycle (ASTM D3389, 2000 cycles, H18Wheels) 200lb/in² min. QT/ECOsilence 0.003" ≥0.6 Pass 259 psi Motivate/ECOfit, Rally/ECOfit Plus, Beast 0.004” Typical > 0.9 <1g, 100 cycles >200 PSI Monster 0.025” >0.8 <1g, 100 cycles >200 PSI 2.6 MARKET PLACEMENT/APPLICATION RULES Technical specifications and product performance results for the flooring products can be found on the manufacturer’s www.ecoreintl.com 2.7 PROPERTIES OF DECLARED PRODUCT AS DELIVERED The products are delivered for installation in the form of rolls, tiles and planks.
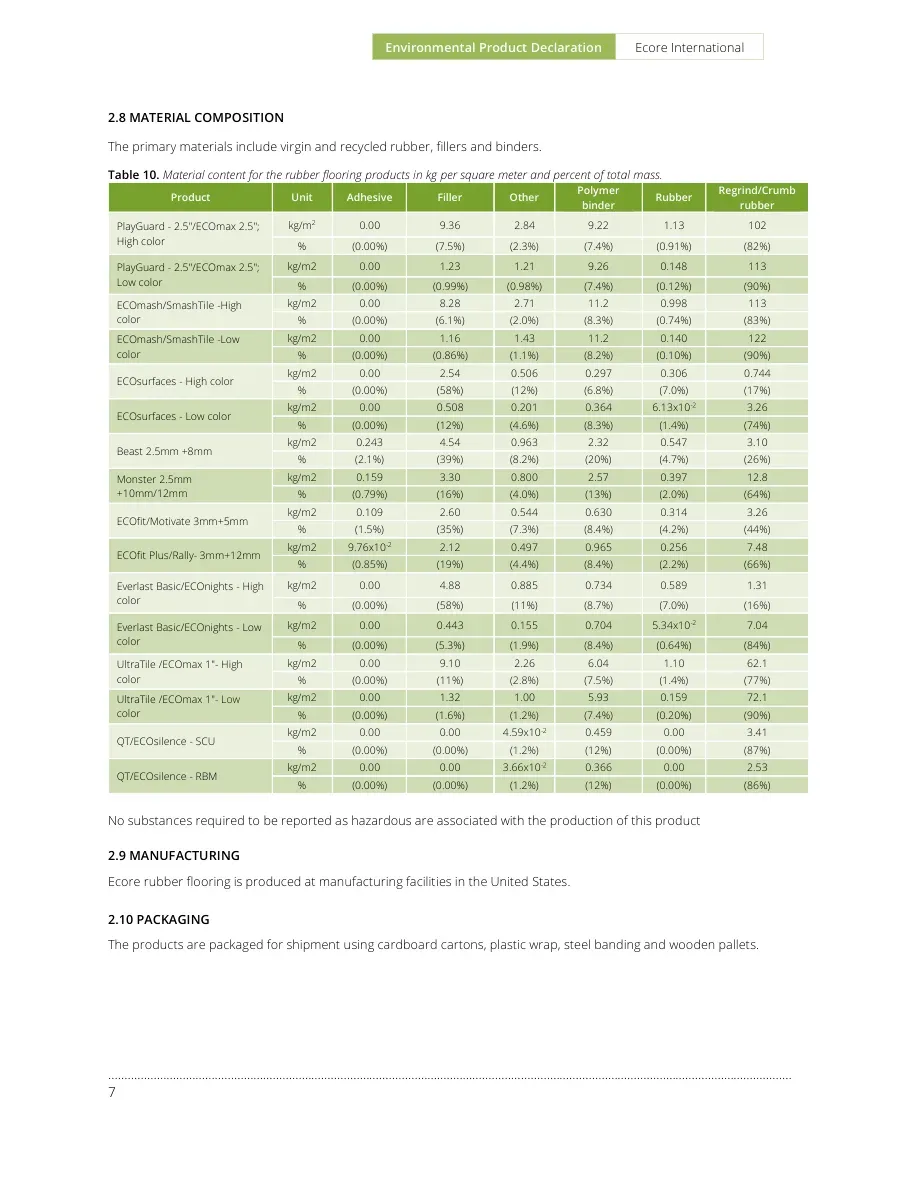
Environmental Product Declaration Ecore International ………………………………………………………………………………………………..………………………………………………………………………………………… 7 2.8 MATERIAL COMPOSITION The primary materials include virgin and recycled rubber, fillers and binders. Table 10. Material content for the rubber flooring products in kg per square meter and percent of total mass. Product Unit Adhesive Filler Other Polymer binder Rubber Regrind/Crumb rubber PlayGuard - 2.5"/ECOmax 2.5"; High color kg/m2 0.00 9.36 2.84 9.22 1.13 102 % (0.00%) (7.5%) (2.3%) (7.4%) (0.91%) (82%) PlayGuard - 2.5"/ECOmax 2.5"; Low color kg/m2 0.00 1.23 1.21 9.26 0.148 113 % (0.00%) (0.99%) (0.98%) (7.4%) (0.12%) (90%) ECOmash/SmashTile -High color kg/m2 0.00 8.28 2.71 11.2 0.998 113 % (0.00%) (6.1%) (2.0%) (8.3%) (0.74%) (83%) ECOmash/SmashTile -Low color kg/m2 0.00 1.16 1.43 11.2 0.140 122 % (0.00%) (0.86%) (1.1%) (8.2%) (0.10%) (90%) ECOsurfaces - High color kg/m2 0.00 2.54 0.506 0.297 0.306 0.744 % (0.00%) (58%) (12%) (6.8%) (7.0%) (17%) ECOsurfaces - Low color kg/m2 0.00 0.508 0.201 0.364 6.13x10⁻² 3.26 % (0.00%) (12%) (4.6%) (8.3%) (1.4%) (74%) Beast 2.5mm +8mm kg/m2 0.243 4.54 0.963 2.32 0.547 3.10 % (2.1%) (39%) (8.2%) (20%) (4.7%) (26%) Monster 2.5mm +10mm/12mm kg/m2 0.159 3.30 0.800 2.57 0.397 12.8 % (0.79%) (16%) (4.0%) (13%) (2.0%) (64%) ECOfit/Motivate 3mm+5mm kg/m2 0.109 2.60 0.544 0.630 0.314 3.26 % (1.5%) (35%) (7.3%) (8.4%) (4.2%) (44%) ECOfit Plus/Rally- 3mm+12mm kg/m2 9.76x10⁻² 2.12 0.497 0.965 0.256 7.48 % (0.85%) (19%) (4.4%) (8.4%) (2.2%) (66%) Everlast Basic/ECOnights - High color kg/m2 0.00 4.88 0.885 0.734 0.589 1.31 % (0.00%) (58%) (11%) (8.7%) (7.0%) (16%) Everlast Basic/ECOnights - Low color kg/m2 0.00 0.443 0.155 0.704 5.34x10⁻² 7.04 % (0.00%) (5.3%) (1.9%) (8.4%) (0.64%) (84%) UltraTile /ECOmax 1"- High color kg/m2 0.00 9.10 2.26 6.04 1.10 62.1 % (0.00%) (11%) (2.8%) (7.5%) (1.4%) (77%) UltraTile /ECOmax 1"- Low color kg/m2 0.00 1.32 1.00 5.93 0.159 72.1 % (0.00%) (1.6%) (1.2%) (7.4%) (0.20%) (90%) QT/ECOsilence - SCU kg/m2 0.00 0.00 4.59x10⁻² 0.459 0.00 3.41 % (0.00%) (0.00%) (1.2%) (12%) (0.00%) (87%) QT/ECOsilence - RBM kg/m2 0.00 0.00 3.66x10⁻² 0.366 0.00 2.53 % (0.00%) (0.00%) (1.2%) (12%) (0.00%) (86%) No substances required to be reported as hazardous are associated with the production of this product 2.9 MANUFACTURING Ecore rubber flooring is produced at manufacturing facilities in the United States. 2.10 PACKAGING The products are packaged for shipment using cardboard cartons, plastic wrap, steel banding and wooden pallets.
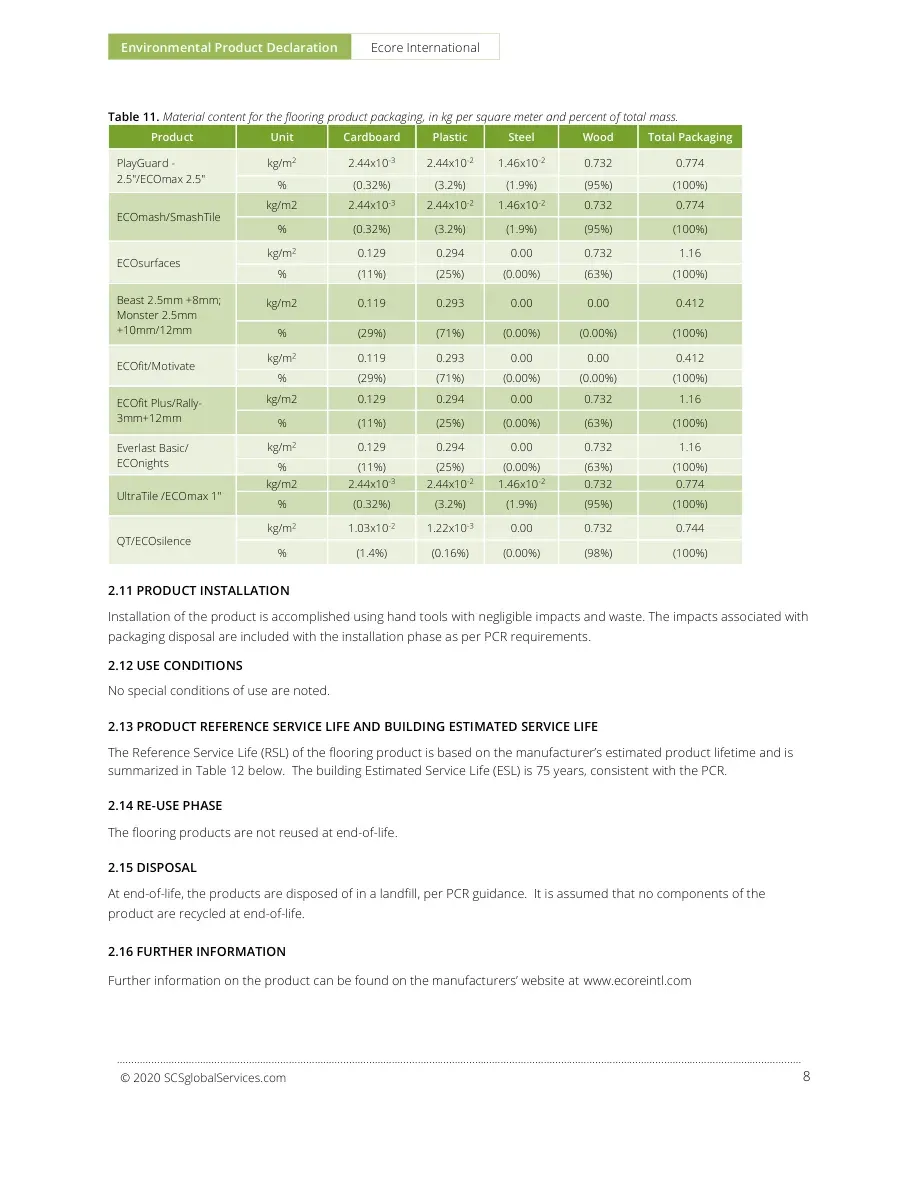
Environmental Product Declaration Ecore International ………………………………………………………………………………………………..………………………………………………………………………………………………………………… 8 © 2020 SCSglobalServices.com Table 11. Material content for the flooring product packaging, in kg per square meter and percent of total mass. Product Unit Cardboard Plastic Steel Wood Total Packaging PlayGuard - 2.5"/ECOmax 2.5" kg/m2 2.44x10⁻³ 2.44x10⁻² 1.46x10⁻² 0.732 0.774 % (0.32%) (3.2%) (1.9%) (95%) (100%) ECOmash/SmashTile kg/m2 2.44x10⁻³ 2.44x10⁻² 1.46x10⁻² 0.732 0.774 % (0.32%) (3.2%) (1.9%) (95%) (100%) ECOsurfaces kg/m2 0.129 0.294 0.00 0.732 1.16 % (11%) (25%) (0.00%) (63%) (100%) Beast 2.5mm +8mm; Monster 2.5mm +10mm/12mm kg/m2 0.119 0.293 0.00 0.00 0.412 % (29%) (71%) (0.00%) (0.00%) (100%) ECOfit/Motivate kg/m2 0.119 0.293 0.00 0.00 0.412 % (29%) (71%) (0.00%) (0.00%) (100%) ECOfit Plus/Rally- 3mm+12mm kg/m2 0.129 0.294 0.00 0.732 1.16 % (11%) (25%) (0.00%) (63%) (100%) Everlast Basic/ ECOnights kg/m2 0.129 0.294 0.00 0.732 1.16 % (11%) (25%) (0.00%) (63%) (100%) UltraTile /ECOmax 1" kg/m2 2.44x10⁻³ 2.44x10⁻² 1.46x10⁻² 0.732 0.774 % (0.32%) (3.2%) (1.9%) (95%) (100%) QT/ECOsilence kg/m2 1.03x10⁻² 1.22x10⁻³ 0.00 0.732 0.744 % (1.4%) (0.16%) (0.00%) (98%) (100%) 2.11 PRODUCT INSTALLATION Installation of the product is accomplished using hand tools with negligible impacts and waste. The impacts associated with packaging disposal are included with the installation phase as per PCR requirements. 2.12 USE CONDITIONS No special conditions of use are noted. 2.13 PRODUCT REFERENCE SERVICE LIFE AND BUILDING ESTIMATED SERVICE LIFE The Reference Service Life (RSL) of the flooring product is based on the manufacturer’s estimated product lifetime and is summarized in Table 12 below. The building Estimated Service Life (ESL) is 75 years, consistent with the PCR. 2.14 RE-USE PHASE The flooring products are not reused at end-of-life. 2.15 DISPOSAL At end-of-life, the products are disposed of in a landfill, per PCR guidance. It is assumed that no components of the product are recycled at end-of-life. 2.16 FURTHER INFORMATION Further information on the product can be found on the manufacturers’ website at www.ecoreintl.com
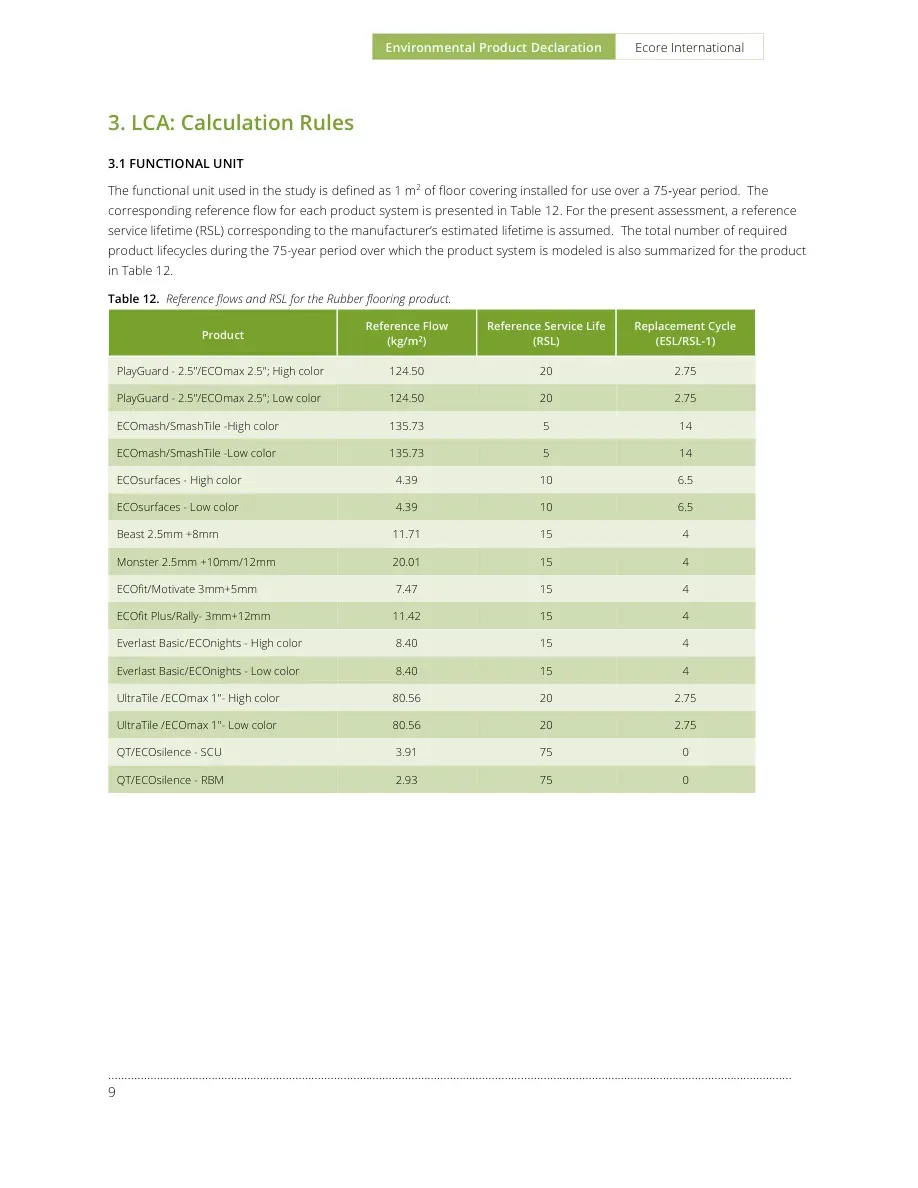
Environmental Product Declaration Ecore International ………………………………………………………………………………………………..………………………………………………………………………………………… 9 3. LCA: Calculation Rules 3.1 FUNCTIONAL UNIT The functional unit used in the study is defined as 1 m2 of floor covering installed for use over a 75‐year period. The corresponding reference flow for each product system is presented in Table 12. For the present assessment, a reference service lifetime (RSL) corresponding to the manufacturer’s estimated lifetime is assumed. The total number of required product lifecycles during the 75-year period over which the product system is modeled is also summarized for the product in Table 12. Table 12. Reference flows and RSL for the Rubber flooring product. Product Reference Flow (kg/m2) Reference Service Life (RSL) Replacement Cycle (ESL/RSL-1) PlayGuard - 2.5"/ECOmax 2.5"; High color 124.50 20 2.75 PlayGuard - 2.5"/ECOmax 2.5"; Low color 124.50 20 2.75 ECOmash/SmashTile -High color 135.73 5 14 ECOmash/SmashTile -Low color 135.73 5 14 ECOsurfaces - High color 4.39 10 6.5 ECOsurfaces - Low color 4.39 10 6.5 Beast 2.5mm +8mm 11.71 15 4 Monster 2.5mm +10mm/12mm 20.01 15 4 ECOfit/Motivate 3mm+5mm 7.47 15 4 ECOfit Plus/Rally- 3mm+12mm 11.42 15 4 Everlast Basic/ECOnights - High color 8.40 15 4 Everlast Basic/ECOnights - Low color 8.40 15 4 UltraTile /ECOmax 1"- High color 80.56 20 2.75 UltraTile /ECOmax 1"- Low color 80.56 20 2.75 QT/ECOsilence - SCU 3.91 75 0 QT/ECOsilence - RBM 2.93 75 0
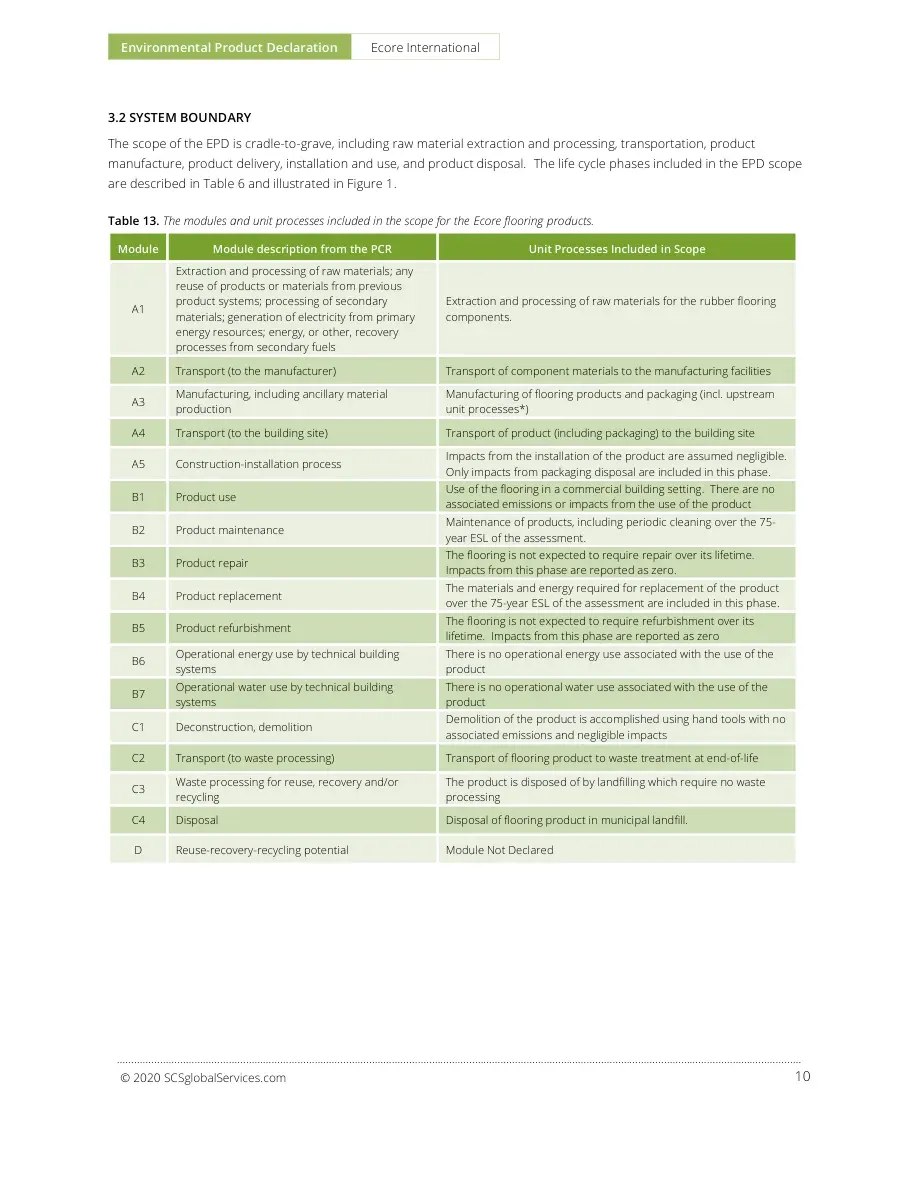
Environmental Product Declaration Ecore International ………………………………………………………………………………………………..………………………………………………………………………………………………………………… 10 © 2020 SCSglobalServices.com 3.2 SYSTEM BOUNDARY The scope of the EPD is cradle-to-grave, including raw material extraction and processing, transportation, product manufacture, product delivery, installation and use, and product disposal. The life cycle phases included in the EPD scope are described in Table 6 and illustrated in Figure 1. Table 13. The modules and unit processes included in the scope for the Ecore flooring products. Module Module description from the PCR Unit Processes Included in Scope A1 Extraction and processing of raw materials; any reuse of products or materials from previous product systems; processing of secondary materials; generation of electricity from primary energy resources; energy, or other, recovery processes from secondary fuels Extraction and processing of raw materials for the rubber flooring components. A2 Transport (to the manufacturer) Transport of component materials to the manufacturing facilities A3 Manufacturing, including ancillary material production Manufacturing of flooring products and packaging (incl. upstream unit processes*) A4 Transport (to the building site) Transport of product (including packaging) to the building site A5 Construction-installation process Impacts from the installation of the product are assumed negligible. Only impacts from packaging disposal are included in this phase. B1 Product use Use of the flooring in a commercial building setting. There are no associated emissions or impacts from the use of the product B2 Product maintenance Maintenance of products, including periodic cleaning over the 75-year ESL of the assessment. B3 Product repair The flooring is not expected to require repair over its lifetime. Impacts from this phase are reported as zero. B4 Product replacement The materials and energy required for replacement of the product over the 75-year ESL of the assessment are included in this phase. B5 Product refurbishment The flooring is not expected to require refurbishment over its lifetime. Impacts from this phase are reported as zero B6 Operational energy use by technical building systems There is no operational energy use associated with the use of the product B7 Operational water use by technical building systems There is no operational water use associated with the use of the product C1 Deconstruction, demolition Demolition of the product is accomplished using hand tools with no associated emissions and negligible impacts C2 Transport (to waste processing) Transport of flooring product to waste treatment at end-of-life C3 Waste processing for reuse, recovery and/or recycling The product is disposed of by landfilling which require no waste processing C4 Disposal Disposal of flooring product in municipal landfill. D Reuse-recovery-recycling potential Module Not Declared
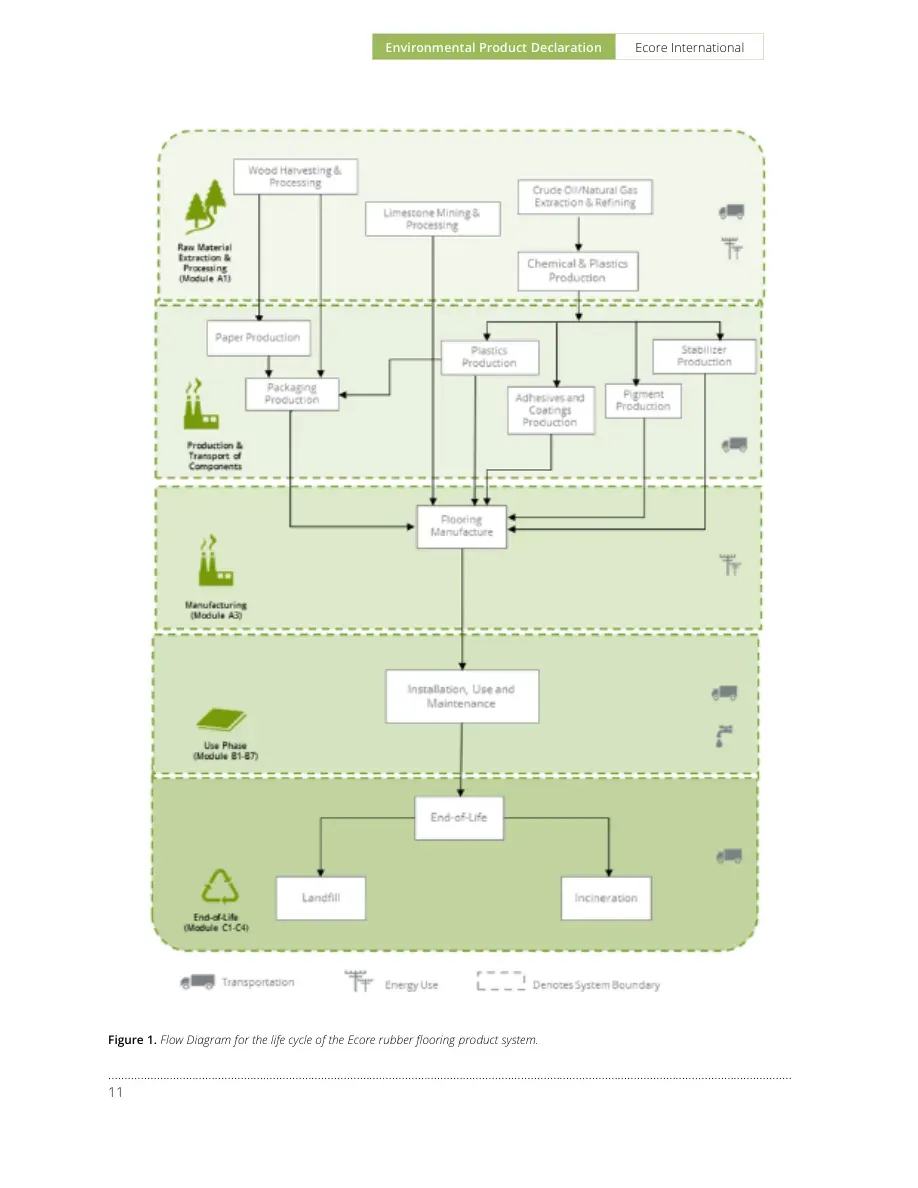
Environmental Product Declaration Ecore International ………………………………………………………………………………………………..………………………………………………………………………………………… 11 Figure 1. Flow Diagram for the life cycle of the Ecore rubber flooring product system.
Environmental Product Declaration Ecore International ………………………………………………………………………………………………..………………………………………………………………………………………………………………… 12 © 2020 SCSglobalServices.com 3.3 PRODUCT SPECIFIC CALCULATION FOR USE PHASE The recommended cleaning regime is highly dependent on the use of the premises where the floor covering is installed. In high traffic areas more frequent cleaning will be needed compared to areas where there is low traffic. For the purposes of this EPD, average maintenance (moderate traffic levels) is presented based on typical installations. 3.4 UNITS All data and results are presented using SI units. 3.5 ESTIMATES AND ASSUMPTIONS ▪ The Reference Service Life (RSL) of the products was modeled based on information provided by the manufacturer assuming their products are installed and maintained as recommended and used for the specific application noted. ▪ For the product end-of-life, disposal of product and packaging is modeled based on the PCR guidance regarding recycling rates of product and packaging materials. ▪ For final disposal of the packaging material and flooring products at end-of-life, all materials are assumed to be transported 20 miles by diesel truck to either a landfill or material reclamation facility (for recycling). Datasets representing disposal in a landfill and waste incineration are from Ecoinvent. ▪ Modeling of recycled materials follows the recycled content method (also known as 100-0 method or cut-off method) whereby only the burdens of reprocessing the waste material are allocated to the system from the use of the recycled material. ▪ Electricity use at the Lancaster and York, Pennsylvania manufacturing facilities was allocated to the Ecore flooring products based on the product area as a fraction of the total production. ▪ Ecore International production facilities are located in the RFCE eGRID EPA NERC subregion. An Ecoinvent inventory dataset was modified to reflect the eGRID energy mix for RFCE to estimate resource use and emissions from electricity use at the Ecore manufacturing facilities. ▪ Downstream transport was modeled based on information provided by the manufacturer representing transport for global product distribution. ▪ The use phase of the product life cycle was modeled based on information provided by the manufacturer including recommended installation and cleaning methods, as well as cleaning frequency. The PCR requires the results for several inventory flows related to construction products to be reported including energy and resource use and waste and outflows. These are aggregated inventory flows, and do not characterize any potential impact; results should be interpreted considering this limitation. 3.6 CUT-OFF RULES According to the PCR, processes contributing greater than 1% of the total environmental impact indicator for each impact are included in the inventory. No data gaps were allowed which were expected to significantly affect the outcome of the indicator results. No known flows are deliberately excluded from this EPD.
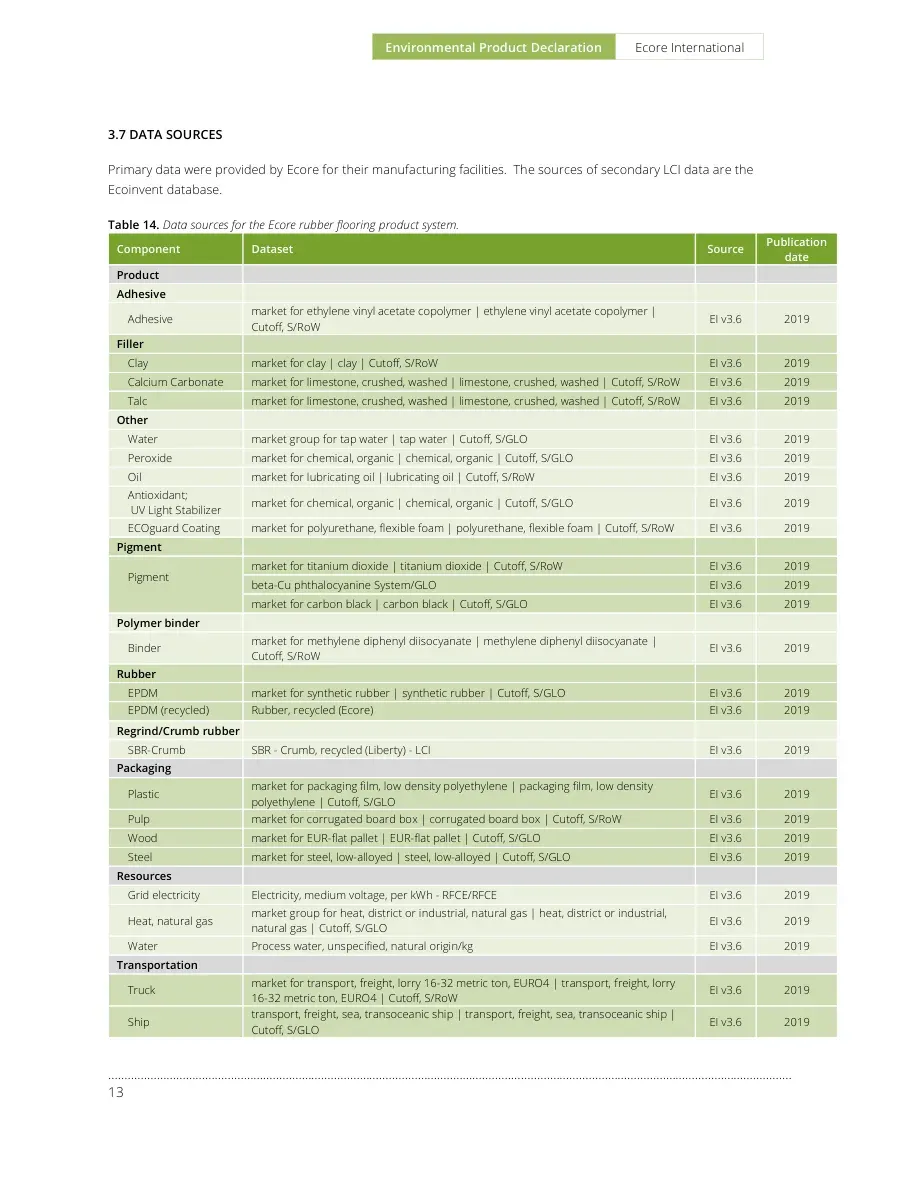
Environmental Product Declaration Ecore International ………………………………………………………………………………………………..………………………………………………………………………………………… 13 3.7 DATA SOURCES Primary data were provided by Ecore for their manufacturing facilities. The sources of secondary LCI data are the Ecoinvent database. Table 14. Data sources for the Ecore rubber flooring product system. Component Dataset Source Publication date Product Adhesive Adhesive market for ethylene vinyl acetate copolymer | ethylene vinyl acetate copolymer | Cutoff, S/RoW EI v3.6 2019 Filler Clay market for clay | clay | Cutoff, S/RoW EI v3.6 2019 Calcium Carbonate market for limestone, crushed, washed | limestone, crushed, washed | Cutoff, S/RoW EI v3.6 2019 Talc market for limestone, crushed, washed | limestone, crushed, washed | Cutoff, S/RoW EI v3.6 2019 Other Water market group for tap water | tap water | Cutoff, S/GLO EI v3.6 2019 Peroxide market for chemical, organic | chemical, organic | Cutoff, S/GLO EI v3.6 2019 Oil market for lubricating oil | lubricating oil | Cutoff, S/RoW EI v3.6 2019 Antioxidant; UV Light Stabilizer market for chemical, organic | chemical, organic | Cutoff, S/GLO EI v3.6 2019 ECOguard Coating market for polyurethane, flexible foam | polyurethane, flexible foam | Cutoff, S/RoW EI v3.6 2019 Pigment Pigment market for titanium dioxide | titanium dioxide | Cutoff, S/RoW EI v3.6 2019 beta-Cu phthalocyanine System/GLO EI v3.6 2019 market for carbon black | carbon black | Cutoff, S/GLO EI v3.6 2019 Polymer binder Binder market for methylene diphenyl diisocyanate | methylene diphenyl diisocyanate | Cutoff, S/RoW EI v3.6 2019 Rubber EPDM market for synthetic rubber | synthetic rubber | Cutoff, S/GLO EI v3.6 2019 EPDM (recycled) Rubber, recycled (Ecore) EI v3.6 2019 Regrind/Crumb rubber SBR-Crumb SBR - Crumb, recycled (Liberty) - LCI EI v3.6 2019 Packaging Plastic market for packaging film, low density polyethylene | packaging film, low density polyethylene | Cutoff, S/GLO EI v3.6 2019 Pulp market for corrugated board box | corrugated board box | Cutoff, S/RoW EI v3.6 2019 Wood market for EUR-flat pallet | EUR-flat pallet | Cutoff, S/GLO EI v3.6 2019 Steel market for steel, low-alloyed | steel, low-alloyed | Cutoff, S/GLO EI v3.6 2019 Resources Grid electricity Electricity, medium voltage, per kWh - RFCE/RFCE EI v3.6 2019 Heat, natural gas market group for heat, district or industrial, natural gas | heat, district or industrial, natural gas | Cutoff, S/GLO EI v3.6 2019 Water Process water, unspecified, natural origin/kg EI v3.6 2019 Transportation Truck market for transport, freight, lorry 16-32 metric ton, EURO4 | transport, freight, lorry 16-32 metric ton, EURO4 | Cutoff, S/RoW EI v3.6 2019 Ship transport, freight, sea, transoceanic ship | transport, freight, sea, transoceanic ship | Cutoff, S/GLO EI v3.6 2019
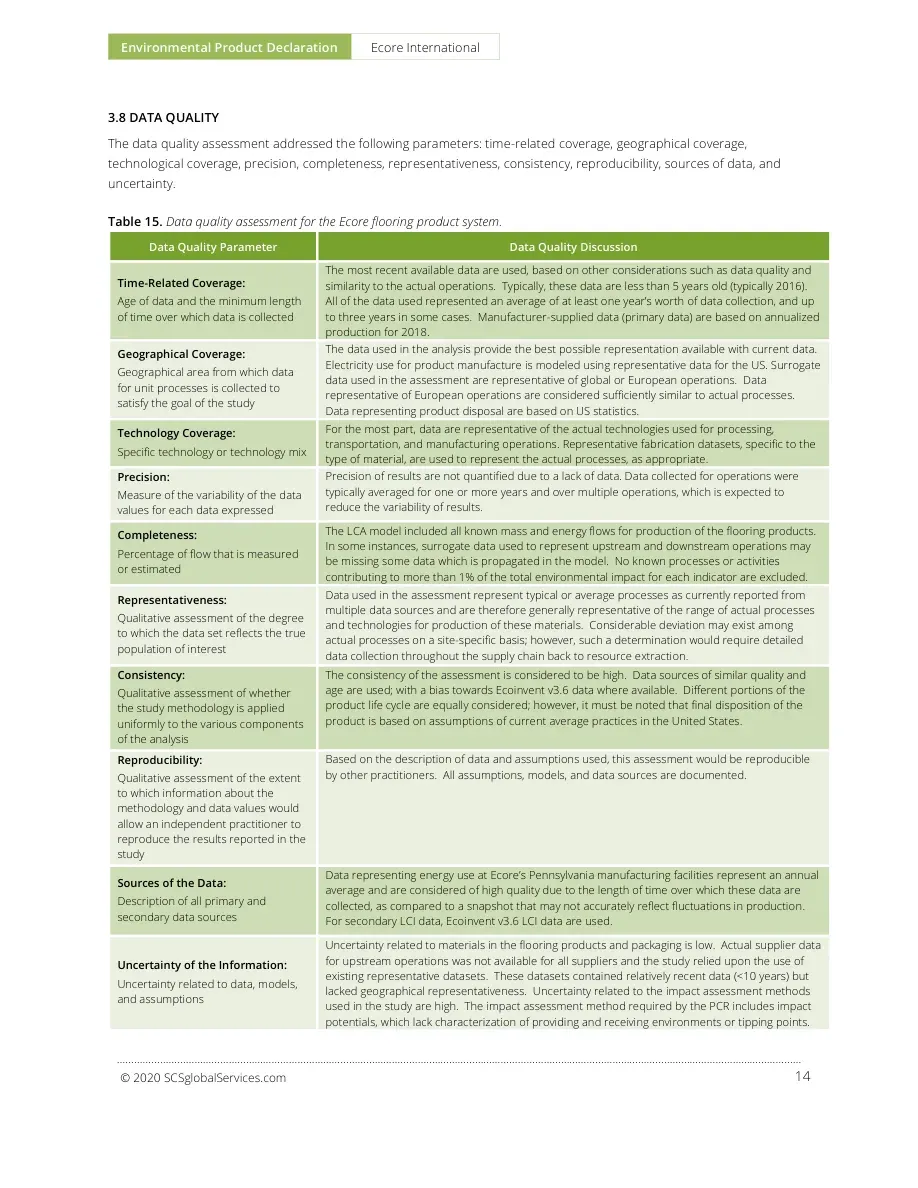
Environmental Product Declaration Ecore International ………………………………………………………………………………………………..………………………………………………………………………………………………………………… 14 © 2020 SCSglobalServices.com 3.8 DATA QUALITY The data quality assessment addressed the following parameters: time-related coverage, geographical coverage, technological coverage, precision, completeness, representativeness, consistency, reproducibility, sources of data, and uncertainty. Table 15. Data quality assessment for the Ecore flooring product system. Data Quality Parameter Data Quality Discussion Time-Related Coverage: Age of data and the minimum length of time over which data is collected The most recent available data are used, based on other considerations such as data quality and similarity to the actual operations. Typically, these data are less than 5 years old (typically 2016). All of the data used represented an average of at least one year’s worth of data collection, and up to three years in some cases. Manufacturer-supplied data (primary data) are based on annualized production for 2018. Geographical Coverage: Geographical area from which data for unit processes is collected to satisfy the goal of the study The data used in the analysis provide the best possible representation available with current data. Electricity use for product manufacture is modeled using representative data for the US. Surrogate data used in the assessment are representative of global or European operations. Data representative of European operations are considered sufficiently similar to actual processes. Data representing product disposal are based on US statistics. Technology Coverage: Specific technology or technology mix For the most part, data are representative of the actual technologies used for processing, transportation, and manufacturing operations. Representative fabrication datasets, specific to the type of material, are used to represent the actual processes, as appropriate. Precision: Measure of the variability of the data values for each data expressed Precision of results are not quantified due to a lack of data. Data collected for operations were typically averaged for one or more years and over multiple operations, which is expected to reduce the variability of results. Completeness: Percentage of flow that is measured or estimated The LCA model included all known mass and energy flows for production of the flooring products. In some instances, surrogate data used to represent upstream and downstream operations may be missing some data which is propagated in the model. No known processes or activities contributing to more than 1% of the total environmental impact for each indicator are excluded. Representativeness: Qualitative assessment of the degree to which the data set reflects the true population of interest Data used in the assessment represent typical or average processes as currently reported from multiple data sources and are therefore generally representative of the range of actual processes and technologies for production of these materials. Considerable deviation may exist among actual processes on a site-specific basis; however, such a determination would require detailed data collection throughout the supply chain back to resource extraction. Consistency: Qualitative assessment of whether the study methodology is applied uniformly to the various components of the analysis The consistency of the assessment is considered to be high. Data sources of similar quality and age are used; with a bias towards Ecoinvent v3.6 data where available. Different portions of the product life cycle are equally considered; however, it must be noted that final disposition of the product is based on assumptions of current average practices in the United States. Reproducibility: Qualitative assessment of the extent to which information about the methodology and data values would allow an independent practitioner to reproduce the results reported in the study Based on the description of data and assumptions used, this assessment would be reproducible by other practitioners. All assumptions, models, and data sources are documented. Sources of the Data: Description of all primary and secondary data sources Data representing energy use at Ecore’s Pennsylvania manufacturing facilities represent an annual average and are considered of high quality due to the length of time over which these data are collected, as compared to a snapshot that may not accurately reflect fluctuations in production. For secondary LCI data, Ecoinvent v3.6 LCI data are used. Uncertainty of the Information: Uncertainty related to data, models, and assumptions Uncertainty related to materials in the flooring products and packaging is low. Actual supplier data for upstream operations was not available for all suppliers and the study relied upon the use of existing representative datasets. These datasets contained relatively recent data (<10 years) but lacked geographical representativeness. Uncertainty related to the impact assessment methods used in the study are high. The impact assessment method required by the PCR includes impact potentials, which lack characterization of providing and receiving environments or tipping points.
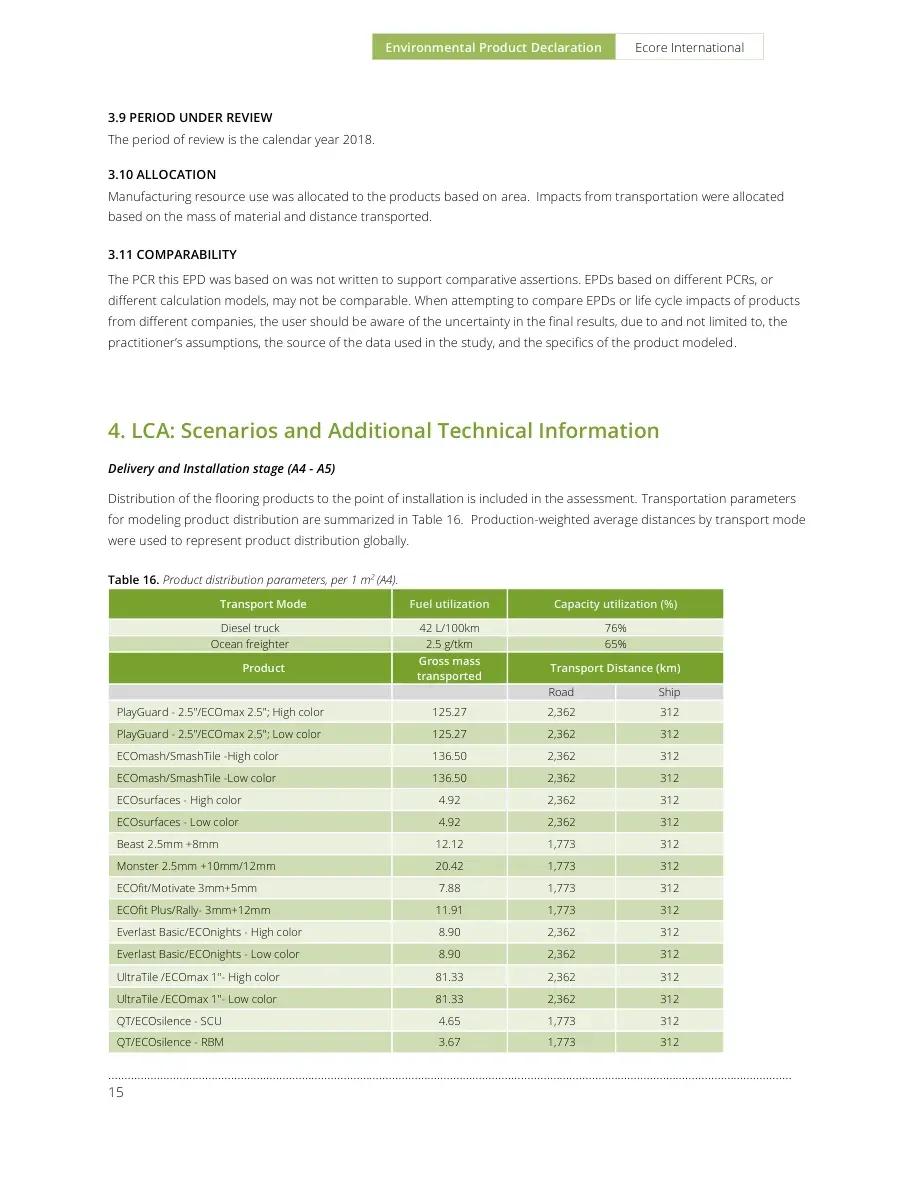
Environmental Product Declaration Ecore International ………………………………………………………………………………………………..………………………………………………………………………………………… 15 3.9 PERIOD UNDER REVIEW The period of review is the calendar year 2018. 3.10 ALLOCATION Manufacturing resource use was allocated to the products based on area. Impacts from transportation were allocated based on the mass of material and distance transported. 3.11 COMPARABILITY The PCR this EPD was based on was not written to support comparative assertions. EPDs based on different PCRs, or different calculation models, may not be comparable. When attempting to compare EPDs or life cycle impacts of products from different companies, the user should be aware of the uncertainty in the final results, due to and not limited to, the practitioner’s assumptions, the source of the data used in the study, and the specifics of the product modeled. 4. LCA: Scenarios and Additional Technical Information Delivery and Installation stage (A4 - A5) Distribution of the flooring products to the point of installation is included in the assessment. Transportation parameters for modeling product distribution are summarized in Table 16. Production-weighted average distances by transport mode were used to represent product distribution globally. Table 16. Product distribution parameters, per 1 m2 (A4). Transport Mode Fuel utilization Capacity utilization (%) Diesel truck 42 L/100km 76% Ocean freighter 2.5 g/tkm 65% Product Gross mass transported Transport Distance (km) Road Ship PlayGuard - 2.5"/ECOmax 2.5"; High color 125.27 2,362 312 PlayGuard - 2.5"/ECOmax 2.5"; Low color 125.27 2,362 312 ECOmash/SmashTile -High color 136.50 2,362 312 ECOmash/SmashTile -Low color 136.50 2,362 312 ECOsurfaces - High color 4.92 2,362 312 ECOsurfaces - Low color 4.92 2,362 312 Beast 2.5mm +8mm 12.12 1,773 312 Monster 2.5mm +10mm/12mm 20.42 1,773 312 ECOfit/Motivate 3mm+5mm 7.88 1,773 312 ECOfit Plus/Rally- 3mm+12mm 11.91 1,773 312 Everlast Basic/ECOnights - High color 8.90 2,362 312 Everlast Basic/ECOnights - Low color 8.90 2,362 312 UltraTile /ECOmax 1"- High color 81.33 2,362 312 UltraTile /ECOmax 1"- Low color 81.33 2,362 312 QT/ECOsilence - SCU 4.65 1,773 312 QT/ECOsilence - RBM 3.67 1,773 312
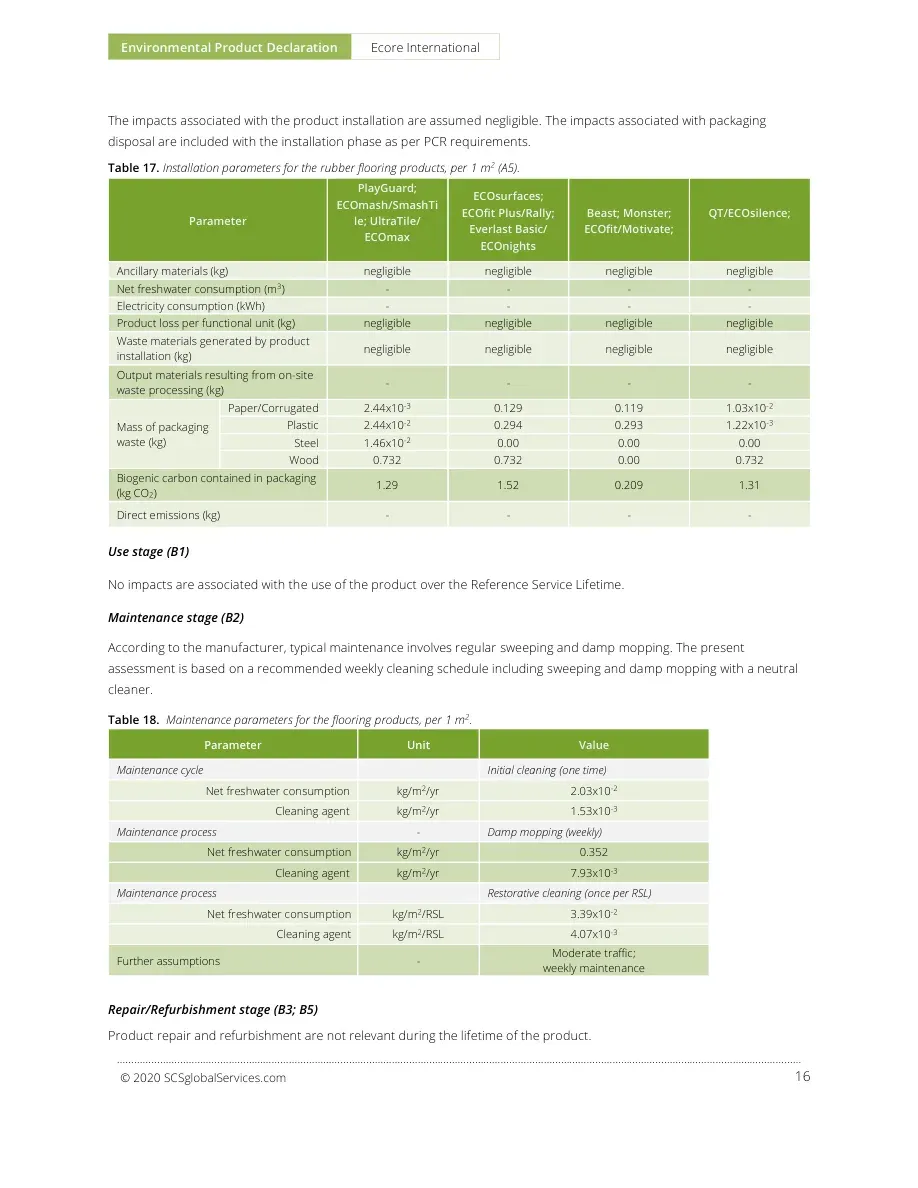
Environmental Product Declaration Ecore International ………………………………………………………………………………………………..………………………………………………………………………………………………………………… 16 © 2020 SCSglobalServices.com The impacts associated with the product installation are assumed negligible. The impacts associated with packaging disposal are included with the installation phase as per PCR requirements. Table 17. Installation parameters for the rubber flooring products, per 1 m2 (A5). Parameter PlayGuard; ECOmash/SmashTile; UltraTile/ ECOmax ECOsurfaces; ECOfit Plus/Rally; Everlast Basic/ ECOnights Beast; Monster; ECOfit/Motivate; QT/ECOsilence; Ancillary materials (kg) negligible negligible negligible negligible Net freshwater consumption (m3) - - - - Electricity consumption (kWh) - - - - Product loss per functional unit (kg) negligible negligible negligible negligible Waste materials generated by product installation (kg) negligible negligible negligible negligible Output materials resulting from on-site waste processing (kg) - - - - Mass of packaging waste (kg) Paper/Corrugated 2.44x10⁻³ 0.129 0.119 1.03x10⁻² Plastic 2.44x10⁻² 0.294 0.293 1.22x10⁻³ Steel 1.46x10⁻² 0.00 0.00 0.00 Wood 0.732 0.732 0.00 0.732 Biogenic carbon contained in packaging (kg CO2) 1.29 1.52 0.209 1.31 Direct emissions (kg) - - - - Use stage (B1) No impacts are associated with the use of the product over the Reference Service Lifetime. Maintenance stage (B2) According to the manufacturer, typical maintenance involves regular sweeping and damp mopping. The present assessment is based on a recommended weekly cleaning schedule including sweeping and damp mopping with a neutral cleaner. Table 18. Maintenance parameters for the flooring products, per 1 m2. Parameter Unit Value Maintenance cycle Initial cleaning (one time) Net freshwater consumption kg/m2/yr 2.03x10⁻² Cleaning agent kg/m2/yr 1.53x10⁻³ Maintenance process - Damp mopping (weekly) Net freshwater consumption kg/m2/yr 0.352 Cleaning agent kg/m2/yr 7.93x10⁻³ Maintenance process Restorative cleaning (once per RSL) Net freshwater consumption kg/m2/RSL 3.39x10⁻² Cleaning agent kg/m2/RSL 4.07x10⁻³ Further assumptions - Moderate traffic; weekly maintenance Repair/Refurbishment stage (B3; B5) Product repair and refurbishment are not relevant during the lifetime of the product.
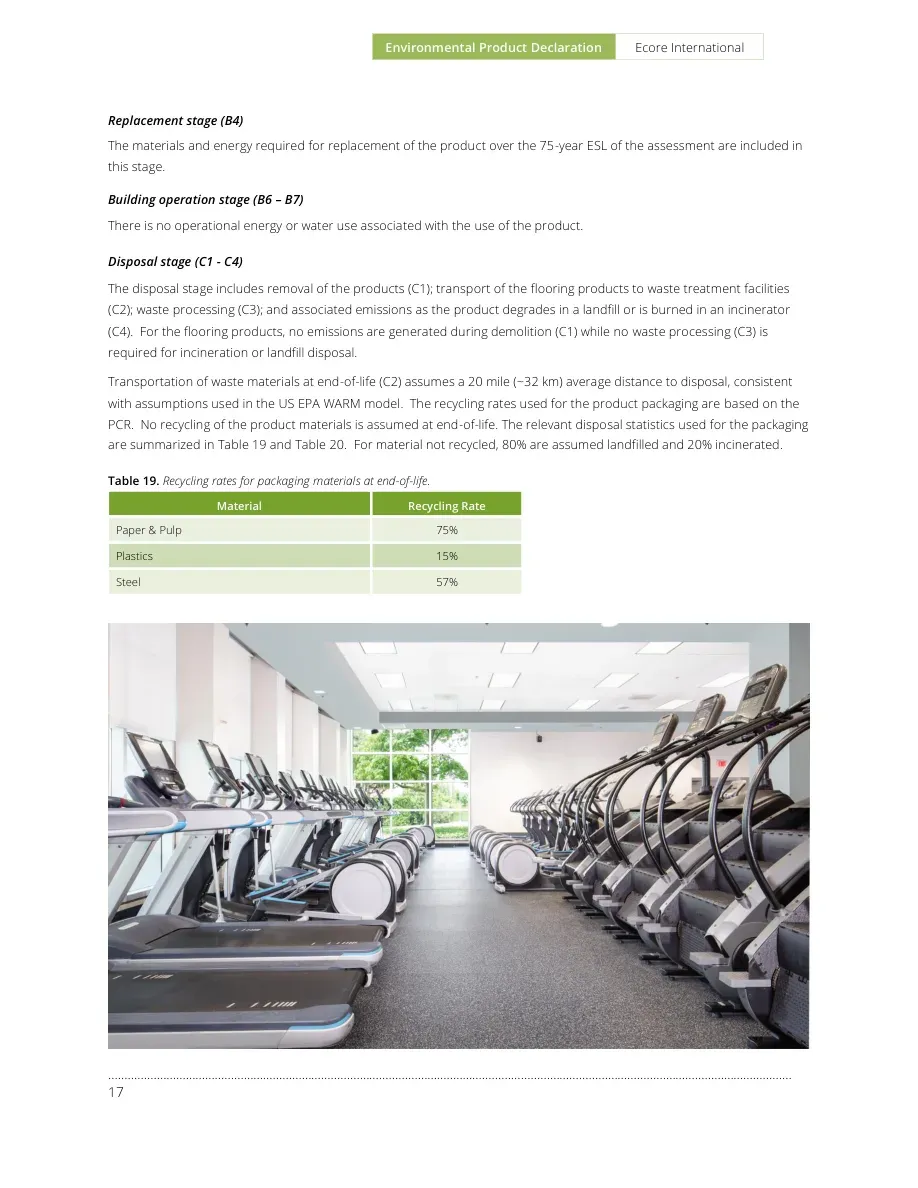
Environmental Product Declaration Ecore International ………………………………………………………………………………………………..………………………………………………………………………………………… 17 Replacement stage (B4) The materials and energy required for replacement of the product over the 75-year ESL of the assessment are included in this stage. Building operation stage (B6 – B7) There is no operational energy or water use associated with the use of the product. Disposal stage (C1 - C4) The disposal stage includes removal of the products (C1); transport of the flooring products to waste treatment facilities (C2); waste processing (C3); and associated emissions as the product degrades in a landfill or is burned in an incinerator (C4). For the flooring products, no emissions are generated during demolition (C1) while no waste processing (C3) is required for incineration or landfill disposal. Transportation of waste materials at end-of-life (C2) assumes a 20 mile (~32 km) average distance to disposal, consistent with assumptions used in the US EPA WARM model. The recycling rates used for the product packaging are based on the PCR. No recycling of the product materials is assumed at end-of-life. The relevant disposal statistics used for the packaging are summarized in Table 19 and Table 20. For material not recycled, 80% are assumed landfilled and 20% incinerated. Table 19. Recycling rates for packaging materials at end-of-life. Material Recycling Rate Paper & Pulp 75% Plastics 15% Steel 57%
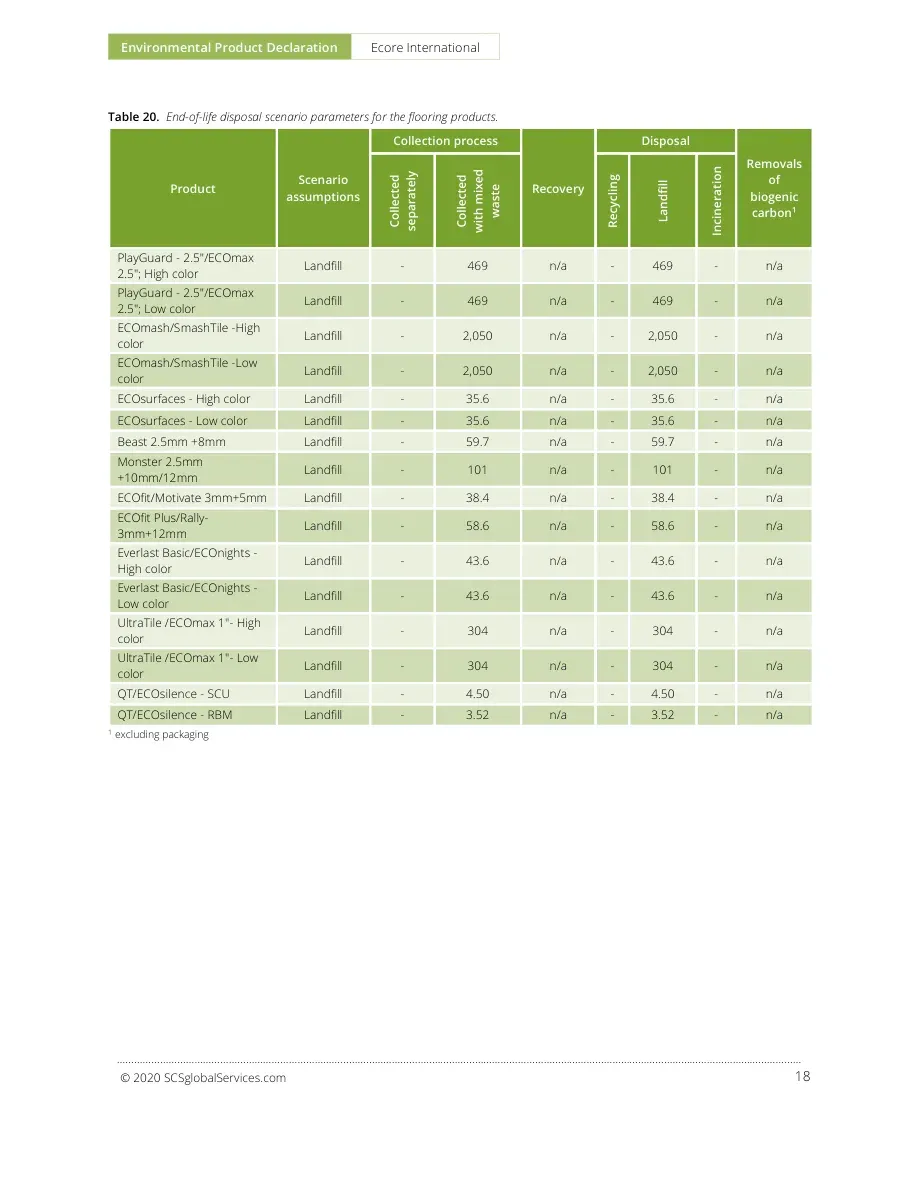
Environmental Product Declaration Ecore International ………………………………………………………………………………………………..………………………………………………………………………………………………………………… 18 © 2020 SCSglobalServices.com Table 20. End-of-life disposal scenario parameters for the flooring products. Product Scenario assumptions Collection process Recovery Disposal Removals of biogenic carbon1 Collected separately Collected with mixed waste Recycling Landfill Incineration PlayGuard - 2.5"/ECOmax 2.5"; High color Landfill - 469 n/a - 469 - n/a PlayGuard - 2.5"/ECOmax 2.5"; Low color Landfill - 469 n/a - 469 - n/a ECOmash/SmashTile -High color Landfill - 2,050 n/a - 2,050 - n/a ECOmash/SmashTile -Low color Landfill - 2,050 n/a - 2,050 - n/a ECOsurfaces - High color Landfill - 35.6 n/a - 35.6 - n/a ECOsurfaces - Low color Landfill - 35.6 n/a - 35.6 - n/a Beast 2.5mm +8mm Landfill - 59.7 n/a - 59.7 - n/a Monster 2.5mm +10mm/12mm Landfill - 101 n/a - 101 - n/a ECOfit/Motivate 3mm+5mm Landfill - 38.4 n/a - 38.4 - n/a ECOfit Plus/Rally- 3mm+12mm Landfill - 58.6 n/a - 58.6 - n/a Everlast Basic/ECOnights - High color Landfill - 43.6 n/a - 43.6 - n/a Everlast Basic/ECOnights - Low color Landfill - 43.6 n/a - 43.6 - n/a UltraTile /ECOmax 1"- High color Landfill - 304 n/a - 304 - n/a UltraTile /ECOmax 1"- Low color Landfill - 304 n/a - 304 - n/a QT/ECOsilence - SCU Landfill - 4.50 n/a - 4.50 - n/a QT/ECOsilence - RBM Landfill - 3.52 n/a - 3.52 - n/a 1 excluding packaging
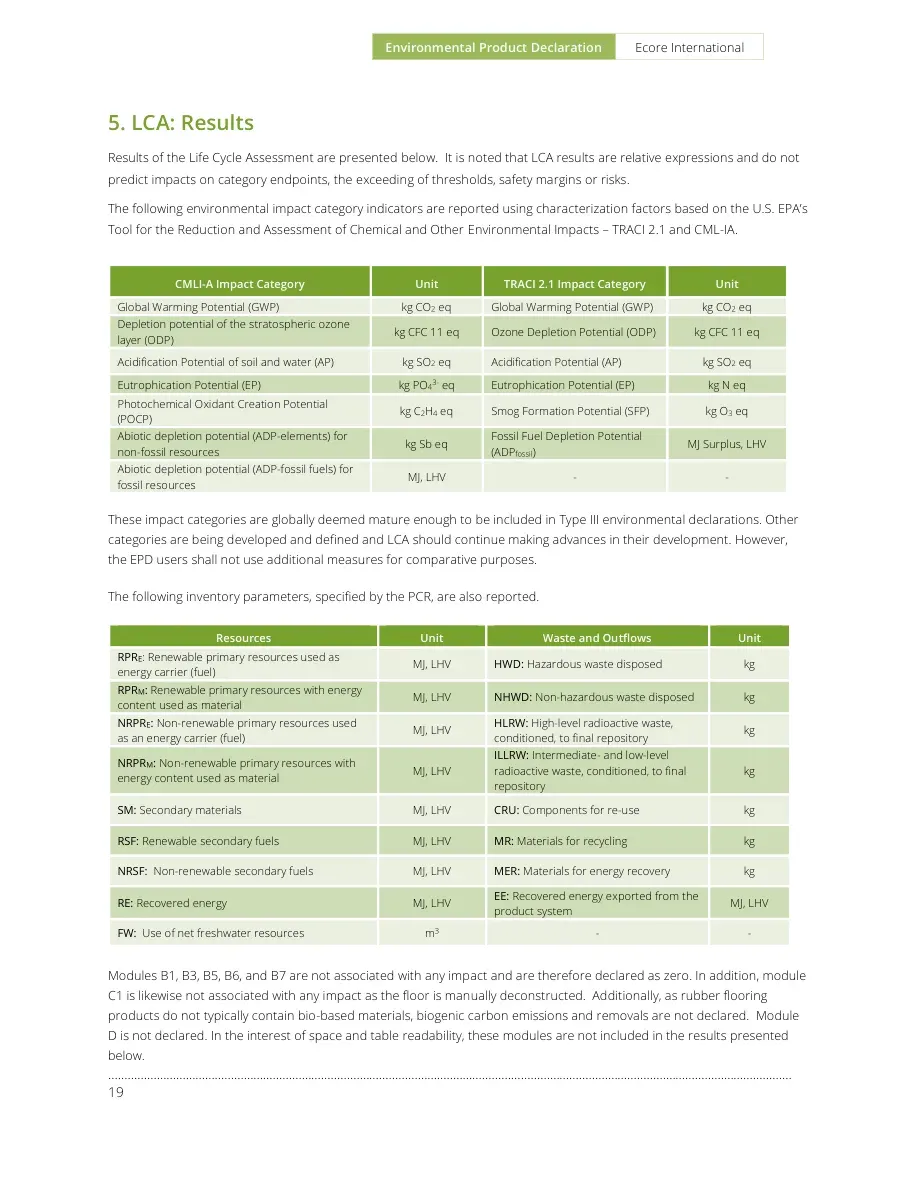
Environmental Product Declaration Ecore International ………………………………………………………………………………………………..………………………………………………………………………………………… 19 5. LCA: Results Results of the Life Cycle Assessment are presented below. It is noted that LCA results are relative expressions and do not predict impacts on category endpoints, the exceeding of thresholds, safety margins or risks. The following environmental impact category indicators are reported using characterization factors based on the U.S. EPA’s Tool for the Reduction and Assessment of Chemical and Other Environmental Impacts – TRACI 2.1 and CML-IA. CMLI-A Impact Category Unit TRACI 2.1 Impact Category Unit Global Warming Potential (GWP) kg CO2 eq Global Warming Potential (GWP) kg CO2 eq Depletion potential of the stratospheric ozone layer (ODP) kg CFC 11 eq Ozone Depletion Potential (ODP) kg CFC 11 eq Acidification Potential of soil and water (AP) kg SO2 eq Acidification Potential (AP) kg SO2 eq Eutrophication Potential (EP) kg PO43- eq Eutrophication Potential (EP) kg N eq Photochemical Oxidant Creation Potential (POCP) kg C2H4 eq Smog Formation Potential (SFP) kg O3 eq Abiotic depletion potential (ADP-elements) for non-fossil resources kg Sb eq Fossil Fuel Depletion Potential (ADPfossil) MJ Surplus, LHV Abiotic depletion potential (ADP-fossil fuels) for fossil resources MJ, LHV - - These impact categories are globally deemed mature enough to be included in Type III environmental declarations. Other categories are being developed and defined and LCA should continue making advances in their development. However, the EPD users shall not use additional measures for comparative purposes. The following inventory parameters, specified by the PCR, are also reported. Resources Unit Waste and Outflows Unit RPRE: Renewable primary resources used as energy carrier (fuel) MJ, LHV HWD: Hazardous waste disposed kg RPRM: Renewable primary resources with energy content used as material MJ, LHV NHWD: Non-hazardous waste disposed kg NRPRE: Non-renewable primary resources used as an energy carrier (fuel) MJ, LHV HLRW: High-level radioactive waste, conditioned, to final repository kg NRPRM: Non-renewable primary resources with energy content used as material MJ, LHV ILLRW: Intermediate- and low-level radioactive waste, conditioned, to final repository kg SM: Secondary materials MJ, LHV CRU: Components for re-use kg RSF: Renewable secondary fuels MJ, LHV MR: Materials for recycling kg NRSF: Non-renewable secondary fuels MJ, LHV MER: Materials for energy recovery kg RE: Recovered energy MJ, LHV EE: Recovered energy exported from the product system MJ, LHV FW: Use of net freshwater resources m3 - - Modules B1, B3, B5, B6, and B7 are not associated with any impact and are therefore declared as zero. In addition, module C1 is likewise not associated with any impact as the floor is manually deconstructed. Additionally, as rubber flooring products do not typically contain bio-based materials, biogenic carbon emissions and removals are not declared. Module D is not declared. In the interest of space and table readability, these modules are not included in the results presented below.
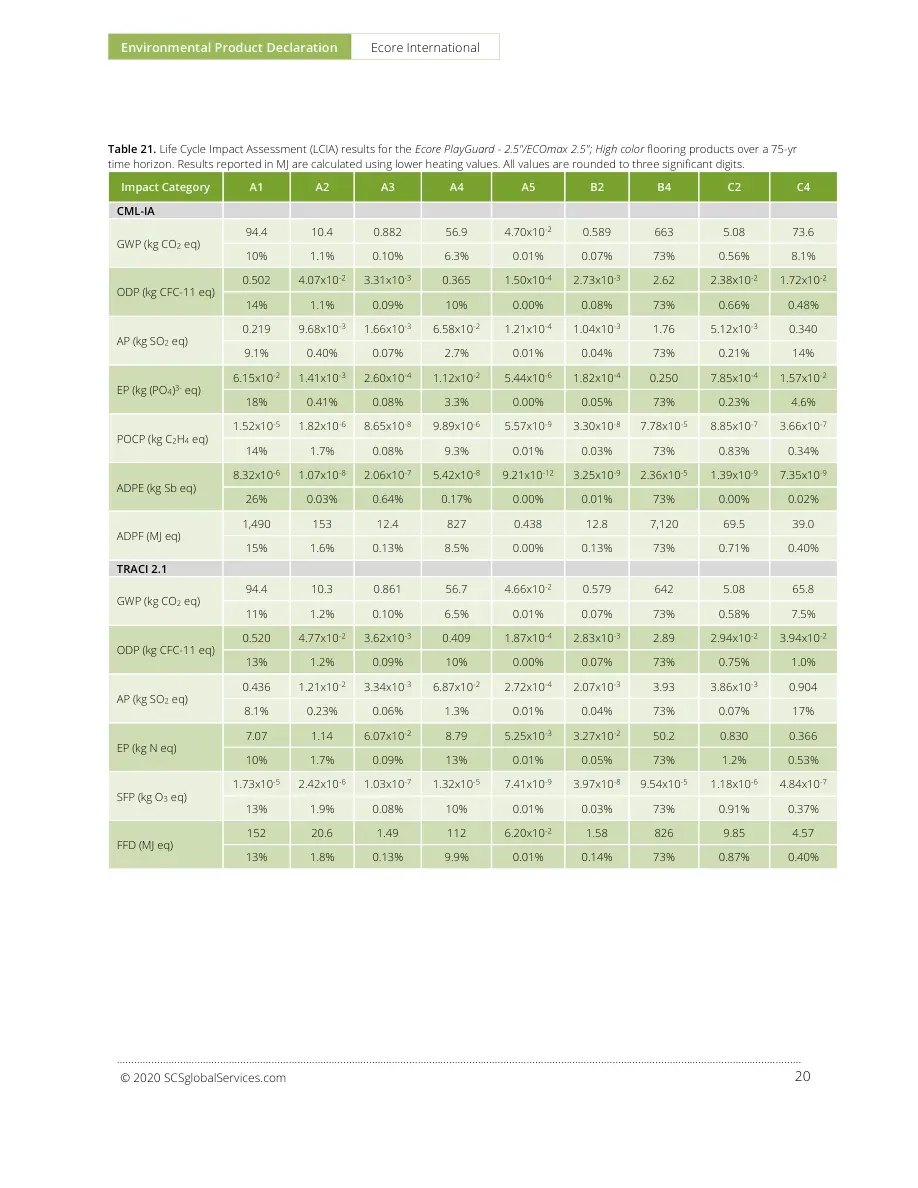
Environmental Product Declaration Ecore International ………………………………………………………………………………………………..………………………………………………………………………………………………………………… 20 © 2020 SCSglobalServices.com Table 21. Life Cycle Impact Assessment (LCIA) results for the Ecore PlayGuard - 2.5"/ECOmax 2.5"; High color flooring products over a 75-yr time horizon. Results reported in MJ are calculated using lower heating values. All values are rounded to three significant digits. Impact Category A1 A2 A3 A4 A5 B2 B4 C2 C4 CML-IA GWP (kg CO2 eq) 94.4 10.4 0.882 56.9 4.70x10⁻² 0.589 663 5.08 73.6 10% 1.1% 0.10% 6.3% 0.01% 0.07% 73% 0.56% 8.1% ODP (kg CFC-11 eq) 0.502 4.07x10⁻² 3.31x10⁻³ 0.365 1.50x10⁻⁴ 2.73x10⁻³ 2.62 2.38x10⁻² 1.72x10⁻² 14% 1.1% 0.09% 10% 0.00% 0.08% 73% 0.66% 0.48% AP (kg SO2 eq) 0.219 9.68x10⁻³ 1.66x10⁻³ 6.58x10⁻² 1.21x10⁻⁴ 1.04x10⁻³ 1.76 5.12x10⁻³ 0.340 9.1% 0.40% 0.07% 2.7% 0.01% 0.04% 73% 0.21% 14% EP (kg (PO4)3- eq) 6.15x10⁻² 1.41x10⁻³ 2.60x10⁻⁴ 1.12x10⁻² 5.44x10⁻⁶ 1.82x10⁻⁴ 0.250 7.85x10⁻⁴ 1.57x10⁻² 18% 0.41% 0.08% 3.3% 0.00% 0.05% 73% 0.23% 4.6% POCP (kg C2H4 eq) 1.52x10⁻⁵ 1.82x10⁻⁶ 8.65x10⁻⁸ 9.89x10⁻⁶ 5.57x10⁻⁹ 3.30x10⁻⁸ 7.78x10⁻⁵ 8.85x10⁻⁷ 3.66x10⁻⁷ 14% 1.7% 0.08% 9.3% 0.01% 0.03% 73% 0.83% 0.34% ADPE (kg Sb eq) 8.32x10⁻⁶ 1.07x10⁻⁸ 2.06x10⁻⁷ 5.42x10⁻⁸ 9.21x10⁻¹² 3.25x10⁻⁹ 2.36x10⁻⁵ 1.39x10⁻⁹ 7.35x10⁻⁹ 26% 0.03% 0.64% 0.17% 0.00% 0.01% 73% 0.00% 0.02% ADPF (MJ eq) 1,490 153 12.4 827 0.438 12.8 7,120 69.5 39.0 15% 1.6% 0.13% 8.5% 0.00% 0.13% 73% 0.71% 0.40% TRACI 2.1 GWP (kg CO2 eq) 94.4 10.3 0.861 56.7 4.66x10⁻² 0.579 642 5.08 65.8 11% 1.2% 0.10% 6.5% 0.01% 0.07% 73% 0.58% 7.5% ODP (kg CFC-11 eq) 0.520 4.77x10⁻² 3.62x10⁻³ 0.409 1.87x10⁻⁴ 2.83x10⁻³ 2.89 2.94x10⁻² 3.94x10⁻² 13% 1.2% 0.09% 10% 0.00% 0.07% 73% 0.75% 1.0% AP (kg SO2 eq) 0.436 1.21x10⁻² 3.34x10⁻³ 6.87x10⁻² 2.72x10⁻⁴ 2.07x10⁻³ 3.93 3.86x10⁻³ 0.904 8.1% 0.23% 0.06% 1.3% 0.01% 0.04% 73% 0.07% 17% EP (kg N eq) 7.07 1.14 6.07x10⁻² 8.79 5.25x10⁻³ 3.27x10⁻² 50.2 0.830 0.366 10% 1.7% 0.09% 13% 0.01% 0.05% 73% 1.2% 0.53% SFP (kg O3 eq) 1.73x10⁻⁵ 2.42x10⁻⁶ 1.03x10⁻⁷ 1.32x10⁻⁵ 7.41x10⁻⁹ 3.97x10⁻⁸ 9.54x10⁻⁵ 1.18x10⁻⁶ 4.84x10⁻⁷ 13% 1.9% 0.08% 10% 0.01% 0.03% 73% 0.91% 0.37% FFD (MJ eq) 152 20.6 1.49 112 6.20x10⁻² 1.58 826 9.85 4.57 13% 1.8% 0.13% 9.9% 0.01% 0.14% 73% 0.87% 0.40%
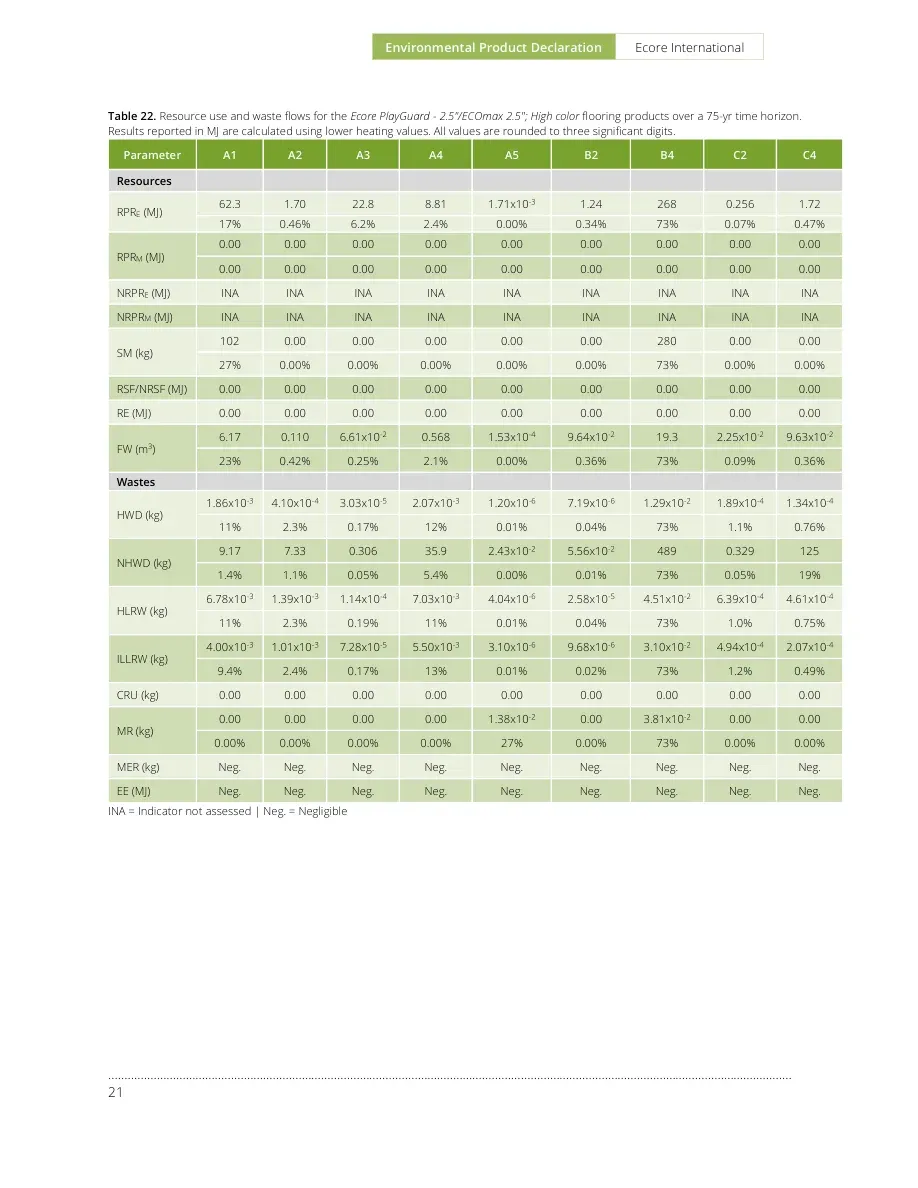
Environmental Product Declaration Ecore International ………………………………………………………………………………………………..………………………………………………………………………………………… 21 Table 22. Resource use and waste flows for the Ecore PlayGuard - 2.5"/ECOmax 2.5"; High color flooring products over a 75-yr time horizon. Results reported in MJ are calculated using lower heating values. All values are rounded to three significant digits. Parameter A1 A2 A3 A4 A5 B2 B4 C2 C4 Resources RPRE (MJ) 62.3 1.70 22.8 8.81 1.71x10⁻³ 1.24 268 0.256 1.72 17% 0.46% 6.2% 2.4% 0.00% 0.34% 73% 0.07% 0.47% RPRM (MJ) 0.00 0.00 0.00 0.00 0.00 0.00 0.00 0.00 0.00 0.00 0.00 0.00 0.00 0.00 0.00 0.00 0.00 0.00 NRPRE (MJ) INA INA INA INA INA INA INA INA INA NRPRM (MJ) INA INA INA INA INA INA INA INA INA SM (kg) 102 0.00 0.00 0.00 0.00 0.00 280 0.00 0.00 27% 0.00% 0.00% 0.00% 0.00% 0.00% 73% 0.00% 0.00% RSF/NRSF (MJ) 0.00 0.00 0.00 0.00 0.00 0.00 0.00 0.00 0.00 RE (MJ) 0.00 0.00 0.00 0.00 0.00 0.00 0.00 0.00 0.00 FW (m3) 6.17 0.110 6.61x10⁻² 0.568 1.53x10⁻⁴ 9.64x10⁻² 19.3 2.25x10⁻² 9.63x10⁻² 23% 0.42% 0.25% 2.1% 0.00% 0.36% 73% 0.09% 0.36% Wastes HWD (kg) 1.86x10⁻³ 4.10x10⁻⁴ 3.03x10⁻⁵ 2.07x10⁻³ 1.20x10⁻⁶ 7.19x10⁻⁶ 1.29x10⁻² 1.89x10⁻⁴ 1.34x10⁻⁴ 11% 2.3% 0.17% 12% 0.01% 0.04% 73% 1.1% 0.76% NHWD (kg) 9.17 7.33 0.306 35.9 2.43x10⁻² 5.56x10⁻² 489 0.329 125 1.4% 1.1% 0.05% 5.4% 0.00% 0.01% 73% 0.05% 19% HLRW (kg) 6.78x10⁻³ 1.39x10⁻³ 1.14x10⁻⁴ 7.03x10⁻³ 4.04x10⁻⁶ 2.58x10⁻⁵ 4.51x10⁻² 6.39x10⁻⁴ 4.61x10⁻⁴ 11% 2.3% 0.19% 11% 0.01% 0.04% 73% 1.0% 0.75% ILLRW (kg) 4.00x10⁻³ 1.01x10⁻³ 7.28x10⁻⁵ 5.50x10⁻³ 3.10x10⁻⁶ 9.68x10⁻⁶ 3.10x10⁻² 4.94x10⁻⁴ 2.07x10⁻⁴ 9.4% 2.4% 0.17% 13% 0.01% 0.02% 73% 1.2% 0.49% CRU (kg) 0.00 0.00 0.00 0.00 0.00 0.00 0.00 0.00 0.00 MR (kg) 0.00 0.00 0.00 0.00 1.38x10⁻² 0.00 3.81x10⁻² 0.00 0.00 0.00% 0.00% 0.00% 0.00% 27% 0.00% 73% 0.00% 0.00% MER (kg) Neg. Neg. Neg. Neg. Neg. Neg. Neg. Neg. Neg. EE (MJ) Neg. Neg. Neg. Neg. Neg. Neg. Neg. Neg. Neg. INA = Indicator not assessed | Neg. = Negligible

Environmental Product Declaration Ecore International ………………………………………………………………………………………………..………………………………………………………………………………………………………………… 22 © 2020 SCSglobalServices.com Table 23. Life Cycle Impact Assessment (LCIA) results for the Ecore PlayGuard - 2.5"/ECOmax 2.5"; Low color flooring products over a 75-yr time horizon. Results reported in MJ are calculated using lower heating values. All values are rounded to three significant digits. Impact Category A1 A2 A3 A4 A5 B2 B4 C2 C4 CML-IA GWP (kg CO2 eq) 85.6 9.11 0.882 56.9 4.70x10⁻² 0.589 636 5.08 73.6 9.9% 1.0% 0.10% 6.6% 0.01% 0.07% 73% 0.59% 8.5% ODP (kg CFC-11 eq) 0.437 3.58x10⁻² 3.31x10⁻³ 0.365 1.50x10⁻⁴ 2.73x10⁻³ 2.43 2.38x10⁻² 1.72x10⁻² 13% 1.1% 0.10% 11% 0.00% 0.08% 73% 0.72% 0.52% AP (kg SO2 eq) 0.211 8.50x10⁻³ 1.66x10⁻³ 6.58x10⁻² 1.21x10⁻⁴ 1.04x10⁻³ 1.74 5.12x10⁻³ 0.340 8.9% 0.36% 0.07% 2.8% 0.01% 0.04% 73% 0.22% 14% EP (kg (PO4)3- eq) 5.77x10⁻² 1.24x10⁻³ 2.60x10⁻⁴ 1.12x10⁻² 5.44x10⁻⁶ 1.82x10⁻⁴ 0.239 7.85x10⁻⁴ 1.57x10⁻² 18% 0.38% 0.08% 3.4% 0.00% 0.06% 73% 0.24% 4.8% POCP (kg C2H4 eq) 1.34x10⁻⁵ 1.60x10⁻⁶ 8.65x10⁻⁸ 9.89x10⁻⁶ 5.57x10⁻⁹ 3.30x10⁻⁸ 7.20x10⁻⁵ 8.85x10⁻⁷ 3.66x10⁻⁷ 14% 1.6% 0.09% 10% 0.01% 0.03% 73% 0.90% 0.37% ADPE (kg Sb eq) 4.67x10⁻⁶ 9.35x10⁻⁹ 2.06x10⁻⁷ 5.42x10⁻⁸ 9.21x10⁻¹² 3.25x10⁻⁹ 1.36x10⁻⁵ 1.39x10⁻⁹ 7.35x10⁻⁹ 25% 0.05% 1.1% 0.29% 0.00% 0.02% 73% 0.01% 0.04% ADPF (MJ eq) 1,240 135 12.4 827 0.438 12.8 6,390 69.5 39.0 14% 1.5% 0.14% 9.5% 0.01% 0.15% 73% 0.80% 0.45% TRACI 2.1 GWP (kg CO2 eq) 85.8 9.08 0.861 56.7 4.66x10⁻² 0.579 614 5.08 65.8 10% 1.1% 0.10% 6.8% 0.01% 0.07% 73% 0.61% 7.8% ODP (kg CFC-11 eq) 0.442 4.19x10⁻² 3.62x10⁻³ 0.409 1.87x10⁻⁴ 2.83x10⁻³ 2.66 2.94x10⁻² 3.94x10⁻² 12% 1.2% 0.10% 11% 0.01% 0.08% 73% 0.81% 1.1% AP (kg SO2 eq) 0.421 1.06x10⁻² 3.34x10⁻³ 6.87x10⁻² 2.72x10⁻⁴ 2.07x10⁻³ 3.88 3.86x10⁻³ 0.904 7.9% 0.20% 0.06% 1.3% 0.01% 0.04% 73% 0.07% 17% EP (kg N eq) 6.26 0.997 6.07x10⁻² 8.79 5.25x10⁻³ 3.27x10⁻² 47.6 0.830 0.366 9.6% 1.5% 0.09% 14% 0.01% 0.05% 73% 1.3% 0.56% SFP (kg O3 eq) 1.49x10⁻⁵ 2.13x10⁻⁶ 1.03x10⁻⁷ 1.32x10⁻⁵ 7.41x10⁻⁹ 3.97x10⁻⁸ 8.79x10⁻⁵ 1.18x10⁻⁶ 4.84x10⁻⁷ 12% 1.8% 0.09% 11% 0.01% 0.03% 73% 0.98% 0.40% FFD (MJ eq) 120 18.1 1.49 112 6.20x10⁻² 1.58 731 9.85 4.57 12% 1.8% 0.15% 11% 0.01% 0.16% 73% 0.99% 0.46%

Environmental Product Declaration Ecore International ………………………………………………………………………………………………..………………………………………………………………………………………… 23 Table 24. Resource use and waste flows for the Ecore PlayGuard - 2.5"/ECOmax 2.5"; Low color flooring products over a 75-yr time horizon. Results reported in MJ are calculated using lower heating values. All values are rounded to three significant digits. Parameter A1 A2 A3 A4 A5 B2 B4 C2 C4 Resources RPRE (MJ) 53.2 1.49 22.8 8.81 1.71x10⁻³ 1.24 243 0.256 1.72 16% 0.45% 6.9% 2.7% 0.00% 0.37% 73% 0.08% 0.52% RPRM (MJ) 0.00 0.00 0.00 0.00 0.00 0.00 0.00 0.00 0.00 0.00 0.00 0.00 0.00 0.00 0.00 0.00 0.00 0.00 NRPRE (MJ) INA INA INA INA INA INA INA INA INA NRPRM (MJ) INA INA INA INA INA INA INA INA INA SM (kg) 113 0.00 0.00 0.00 0.00 0.00 310 0.00 0.00 27% 0.00% 0.00% 0.00% 0.00% 0.00% 73% 0.00% 0.00% RSF/NRSF (MJ) 0.00 0.00 0.00 0.00 0.00 0.00 0.00 0.00 0.00 RE (MJ) 0.00 0.00 0.00 0.00 0.00 0.00 0.00 0.00 0.00 FW (m3) 5.56 9.69x10⁻² 6.61x10⁻² 0.568 1.53x10⁻⁴ 9.64x10⁻² 17.6 2.25x10⁻² 9.62x10⁻² 23% 0.40% 0.27% 2.4% 0.00% 0.40% 73% 0.09% 0.40% Wastes HWD (kg) 1.65x10⁻³ 3.60x10⁻⁴ 3.03x10⁻⁵ 2.07x10⁻³ 1.20x10⁻⁶ 7.19x10⁻⁶ 1.22x10⁻² 1.89x10⁻⁴ 1.34x10⁻⁴ 9.9% 2.2% 0.18% 12% 0.01% 0.04% 73% 1.1% 0.80% NHWD (kg) 7.54 6.44 0.306 35.9 2.43x10⁻² 5.56x10⁻² 482 0.329 125 1.1% 0.98% 0.05% 5.5% 0.00% 0.01% 73% 0.05% 19% HLRW (kg) 6.05x10⁻³ 1.22x10⁻³ 1.14x10⁻⁴ 7.03x10⁻³ 4.04x10⁻⁶ 2.58x10⁻⁵ 4.27x10⁻² 6.39x10⁻⁴ 4.61x10⁻⁴ 10% 2.1% 0.20% 12% 0.01% 0.04% 73% 1.1% 0.79% ILLRW (kg) 3.05x10⁻³ 8.89x10⁻⁴ 7.28x10⁻⁵ 5.50x10⁻³ 3.10x10⁻⁶ 9.68x10⁻⁶ 2.81x10⁻² 4.94x10⁻⁴ 2.07x10⁻⁴ 8.0% 2.3% 0.19% 14% 0.01% 0.03% 73% 1.3% 0.54% CRU (kg) 0.00 0.00 0.00 0.00 0.00 0.00 0.00 0.00 0.00 MR (kg) 0.00 0.00 0.00 0.00 1.38x10⁻² 0.00 3.81x10⁻² 0.00 0.00 0.00% 0.00% 0.00% 0.00% 27% 0.00% 73% 0.00% 0.00% MER (kg) Neg. Neg. Neg. Neg. Neg. Neg. Neg. Neg. Neg. EE (MJ) Neg. Neg. Neg. Neg. Neg. Neg. Neg. Neg. Neg. INA = Indicator not assessed | Neg. = Negligible

Environmental Product Declaration Ecore International ………………………………………………………………………………………………..………………………………………………………………………………………………………………… 24 © 2020 SCSglobalServices.com Table 25. Life Cycle Impact Assessment (LCIA) results for the Ecore ECOmash/SmashTile -High color flooring products over a 75-yr time horizon. Results reported in MJ are calculated using lower heating values. All values are rounded to three significant digits. Impact Category A1 A2 A3 A4 A5 B2 B4 C2 C4 CML-IA GWP (kg CO2 eq) 108 11.0 0.882 62.0 4.70x10⁻² 0.648 3,740 5.54 79.6 2.7% 0.28% 0.02% 1.5% 0.00% 0.02% 93% 0.14% 2.0% ODP (kg CFC-11 eq) 0.557 4.34x10⁻² 3.31x10⁻³ 0.398 1.50x10⁻⁴ 3.00x10⁻³ 14.6 2.59x10⁻² 1.86x10⁻² 3.5% 0.28% 0.02% 2.5% 0.00% 0.02% 93% 0.16% 0.12% AP (kg SO2 eq) 0.254 1.03x10⁻² 1.66x10⁻³ 7.17x10⁻² 1.21x10⁻⁴ 1.15x10⁻³ 10.0 5.58x10⁻³ 0.373 2.4% 0.10% 0.02% 0.67% 0.00% 0.01% 93% 0.05% 3.5% EP (kg (PO4)3- eq) 7.20x10⁻² 1.50x10⁻³ 2.60x10⁻⁴ 1.22x10⁻² 5.44x10⁻⁶ 2.00x10⁻⁴ 1.45 8.56x10⁻⁴ 1.70x10⁻² 4.6% 0.10% 0.02% 0.78% 0.00% 0.01% 93% 0.05% 1.1% POCP (kg C2H4 eq) 1.76x10⁻⁵ 1.94x10⁻⁶ 8.65x10⁻⁸ 1.08x10⁻⁵ 5.57x10⁻⁹ 3.60x10⁻⁸ 4.45x10⁻⁴ 9.65x10⁻⁷ 3.98x10⁻⁷ 3.7% 0.41% 0.02% 2.3% 0.00% 0.01% 93% 0.20% 0.08% ADPE (kg Sb eq) 4.79x10⁻⁶ 1.13x10⁻⁸ 2.06x10⁻⁷ 5.90x10⁻⁸ 9.21x10⁻¹² 3.57x10⁻⁹ 7.10x10⁻⁵ 1.51x10⁻⁹ 7.97x10⁻⁹ 6.3% 0.01% 0.27% 0.08% 0.00% 0.00% 93% 0.00% 0.01% ADPF (MJ eq) 1,670 163 12.4 901 0.438 14.1 40,200 75.7 42.5 3.9% 0.38% 0.03% 2.1% 0.00% 0.03% 93% 0.18% 0.10% TRACI 2.1 GWP (kg CO2 eq) 108 11.0 0.861 61.8 4.66x10⁻² 0.637 3,620 5.53 71.2 2.8% 0.28% 0.02% 1.6% 0.00% 0.02% 93% 0.14% 1.8% ODP (kg CFC-11 eq) 0.565 5.08x10⁻² 3.62x10⁻³ 0.446 1.87x10⁻⁴ 3.11x10⁻³ 16.0 3.20x10⁻² 4.29x10⁻² 3.3% 0.30% 0.02% 2.6% 0.00% 0.02% 93% 0.19% 0.25% AP (kg SO2 eq) 0.503 1.29x10⁻² 3.34x10⁻³ 7.49x10⁻² 2.72x10⁻⁴ 2.27x10⁻³ 22.3 4.20x10⁻³ 0.992 2.1% 0.05% 0.01% 0.31% 0.00% 0.01% 93% 0.02% 4.2% EP (kg N eq) 7.96 1.21 6.07x10⁻² 9.58 5.25x10⁻³ 3.60x10⁻² 282 0.905 0.398 2.6% 0.40% 0.02% 3.2% 0.00% 0.01% 93% 0.30% 0.13% SFP (kg O3 eq) 1.99x10⁻⁵ 2.58x10⁻⁶ 1.03x10⁻⁷ 1.43x10⁻⁵ 7.41x10⁻⁹ 4.33x10⁻⁸ 5.42x10⁻⁴ 1.29x10⁻⁶ 5.27x10⁻⁷ 3.4% 0.44% 0.02% 2.5% 0.00% 0.01% 93% 0.22% 0.09% FFD (MJ eq) 169 21.9 1.49 122 6.20x10⁻² 1.75 4,620 10.7 4.97 3.4% 0.44% 0.03% 2.5% 0.00% 0.04% 93% 0.22% 0.10%
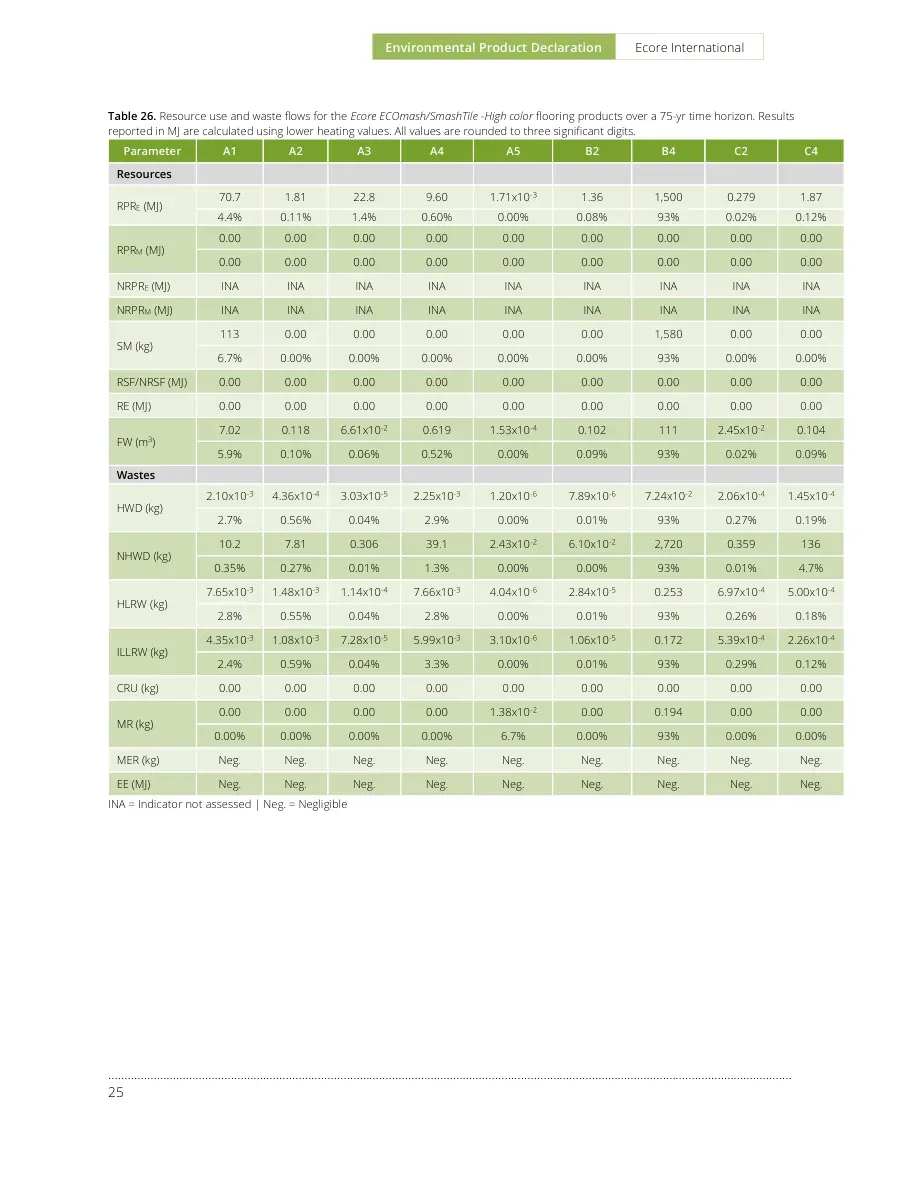
Environmental Product Declaration Ecore International ………………………………………………………………………………………………..………………………………………………………………………………………… 25 Table 26. Resource use and waste flows for the Ecore ECOmash/SmashTile -High color flooring products over a 75-yr time horizon. Results reported in MJ are calculated using lower heating values. All values are rounded to three significant digits. Parameter A1 A2 A3 A4 A5 B2 B4 C2 C4 Resources RPRE (MJ) 70.7 1.81 22.8 9.60 1.71x10⁻³ 1.36 1,500 0.279 1.87 4.4% 0.11% 1.4% 0.60% 0.00% 0.08% 93% 0.02% 0.12% RPRM (MJ) 0.00 0.00 0.00 0.00 0.00 0.00 0.00 0.00 0.00 0.00 0.00 0.00 0.00 0.00 0.00 0.00 0.00 0.00 NRPRE (MJ) INA INA INA INA INA INA INA INA INA NRPRM (MJ) INA INA INA INA INA INA INA INA INA SM (kg) 113 0.00 0.00 0.00 0.00 0.00 1,580 0.00 0.00 6.7% 0.00% 0.00% 0.00% 0.00% 0.00% 93% 0.00% 0.00% RSF/NRSF (MJ) 0.00 0.00 0.00 0.00 0.00 0.00 0.00 0.00 0.00 RE (MJ) 0.00 0.00 0.00 0.00 0.00 0.00 0.00 0.00 0.00 FW (m3) 7.02 0.118 6.61x10⁻² 0.619 1.53x10⁻⁴ 0.102 111 2.45x10⁻² 0.104 5.9% 0.10% 0.06% 0.52% 0.00% 0.09% 93% 0.02% 0.09% Wastes HWD (kg) 2.10x10⁻³ 4.36x10⁻⁴ 3.03x10⁻⁵ 2.25x10⁻³ 1.20x10⁻⁶ 7.89x10⁻⁶ 7.24x10⁻² 2.06x10⁻⁴ 1.45x10⁻⁴ 2.7% 0.56% 0.04% 2.9% 0.00% 0.01% 93% 0.27% 0.19% NHWD (kg) 10.2 7.81 0.306 39.1 2.43x10⁻² 6.10x10⁻² 2,720 0.359 136 0.35% 0.27% 0.01% 1.3% 0.00% 0.00% 93% 0.01% 4.7% HLRW (kg) 7.65x10⁻³ 1.48x10⁻³ 1.14x10⁻⁴ 7.66x10⁻³ 4.04x10⁻⁶ 2.84x10⁻⁵ 0.253 6.97x10⁻⁴ 5.00x10⁻⁴ 2.8% 0.55% 0.04% 2.8% 0.00% 0.01% 93% 0.26% 0.18% ILLRW (kg) 4.35x10⁻³ 1.08x10⁻³ 7.28x10⁻⁵ 5.99x10⁻³ 3.10x10⁻⁶ 1.06x10⁻⁵ 0.172 5.39x10⁻⁴ 2.26x10⁻⁴ 2.4% 0.59% 0.04% 3.3% 0.00% 0.01% 93% 0.29% 0.12% CRU (kg) 0.00 0.00 0.00 0.00 0.00 0.00 0.00 0.00 0.00 MR (kg) 0.00 0.00 0.00 0.00 1.38x10⁻² 0.00 0.194 0.00 0.00 0.00% 0.00% 0.00% 0.00% 6.7% 0.00% 93% 0.00% 0.00% MER (kg) Neg. Neg. Neg. Neg. Neg. Neg. Neg. Neg. Neg. EE (MJ) Neg. Neg. Neg. Neg. Neg. Neg. Neg. Neg. Neg. INA = Indicator not assessed | Neg. = Negligible

Environmental Product Declaration Ecore International ………………………………………………………………………………………………..………………………………………………………………………………………………………………… 26 © 2020 SCSglobalServices.com Table 27. Life Cycle Impact Assessment (LCIA) results for the Ecore ECOmash/SmashTile - Low color flooring products over a 75-yr time horizon. Results reported in MJ are calculated using lower heating values. All values are rounded to three significant digits. Impact Category A1 A2 A3 A4 A5 B2 B4 C2 C4 CML-IA GWP (kg CO2 eq) 101 9.94 0.882 62.0 4.70x10⁻² 0.648 3,620 5.54 79.7 2.6% 0.26% 0.02% 1.6% 0.00% 0.02% 93% 0.14% 2.1% ODP (kg CFC-11 eq) 0.514 3.90x10⁻² 3.31x10⁻³ 0.398 1.50x10⁻⁴ 3.00x10⁻³ 14.0 2.59x10⁻² 1.86x10⁻² 3.4% 0.26% 0.02% 2.7% 0.00% 0.02% 93% 0.17% 0.12% AP (kg SO2 eq) 0.246 9.27x10⁻³ 1.66x10⁻³ 7.17x10⁻² 1.21x10⁻⁴ 1.15x10⁻³ 9.89 5.58x10⁻³ 0.373 2.3% 0.09% 0.02% 0.68% 0.00% 0.01% 93% 0.05% 3.5% EP (kg (PO4)3- eq) 6.90x10⁻² 1.35x10⁻³ 2.60x10⁻⁴ 1.22x10⁻² 5.44x10⁻⁶ 2.00x10⁻⁴ 1.41 8.56x10⁻⁴ 1.70x10⁻² 4.6% 0.09% 0.02% 0.81% 0.00% 0.01% 93% 0.06% 1.1% POCP (kg C2H4 eq) 1.59x10⁻⁵ 1.75x10⁻⁶ 8.65x10⁻⁸ 1.08x10⁻⁵ 5.57x10⁻⁹ 3.60x10⁻⁸ 4.18x10⁻⁴ 9.65x10⁻⁷ 3.98x10⁻⁷ 3.5% 0.39% 0.02% 2.4% 0.00% 0.01% 93% 0.22% 0.09% ADPE (kg Sb eq) 4.74x10⁻⁶ 1.02x10⁻⁸ 2.06x10⁻⁷ 5.90x10⁻⁸ 9.21x10⁻¹² 3.57x10⁻⁹ 7.03x10⁻⁵ 1.51x10⁻⁹ 7.98x10⁻⁹ 6.3% 0.01% 0.27% 0.08% 0.00% 0.00% 93% 0.00% 0.01% ADPF (MJ eq) 1,470 147 12.4 901 0.438 14.1 37,100 75.7 42.5 3.7% 0.37% 0.03% 2.3% 0.00% 0.04% 93% 0.19% 0.11% TRACI 2.1 GWP (kg CO2 eq) 101 9.91 0.861 61.8 4.66x10⁻² 0.637 3,510 5.53 71.2 2.7% 0.26% 0.02% 1.6% 0.00% 0.02% 93% 0.15% 1.9% ODP (kg CFC-11 eq) 0.521 4.57x10⁻² 3.62x10⁻³ 0.446 1.87x10⁻⁴ 3.11x10⁻³ 15.3 3.20x10⁻² 4.29x10⁻² 3.2% 0.28% 0.02% 2.7% 0.00% 0.02% 93% 0.20% 0.26% AP (kg SO2 eq) 0.488 1.16x10⁻² 3.34x10⁻³ 7.49x10⁻² 2.72x10⁻⁴ 2.27x10⁻³ 22.0 4.20x10⁻³ 0.992 2.1% 0.05% 0.01% 0.32% 0.00% 0.01% 93% 0.02% 4.2% EP (kg N eq) 7.44 1.09 6.07x10⁻² 9.58 5.25x10⁻³ 3.60x10⁻² 273 0.905 0.398 2.5% 0.37% 0.02% 3.3% 0.00% 0.01% 93% 0.31% 0.14% SFP (kg O3 eq) 1.77x10⁻⁵ 2.32x10⁻⁶ 1.03x10⁻⁷ 1.43x10⁻⁵ 7.41x10⁻⁹ 4.33x10⁻⁸ 5.08x10⁻⁴ 1.29x10⁻⁶ 5.27x10⁻⁷ 3.3% 0.43% 0.02% 2.6% 0.00% 0.01% 93% 0.24% 0.10% FFD (MJ eq) 143 19.7 1.49 122 6.20x10⁻² 1.75 4,220 10.7 4.97 3.2% 0.44% 0.03% 2.7% 0.00% 0.04% 93% 0.24% 0.11%
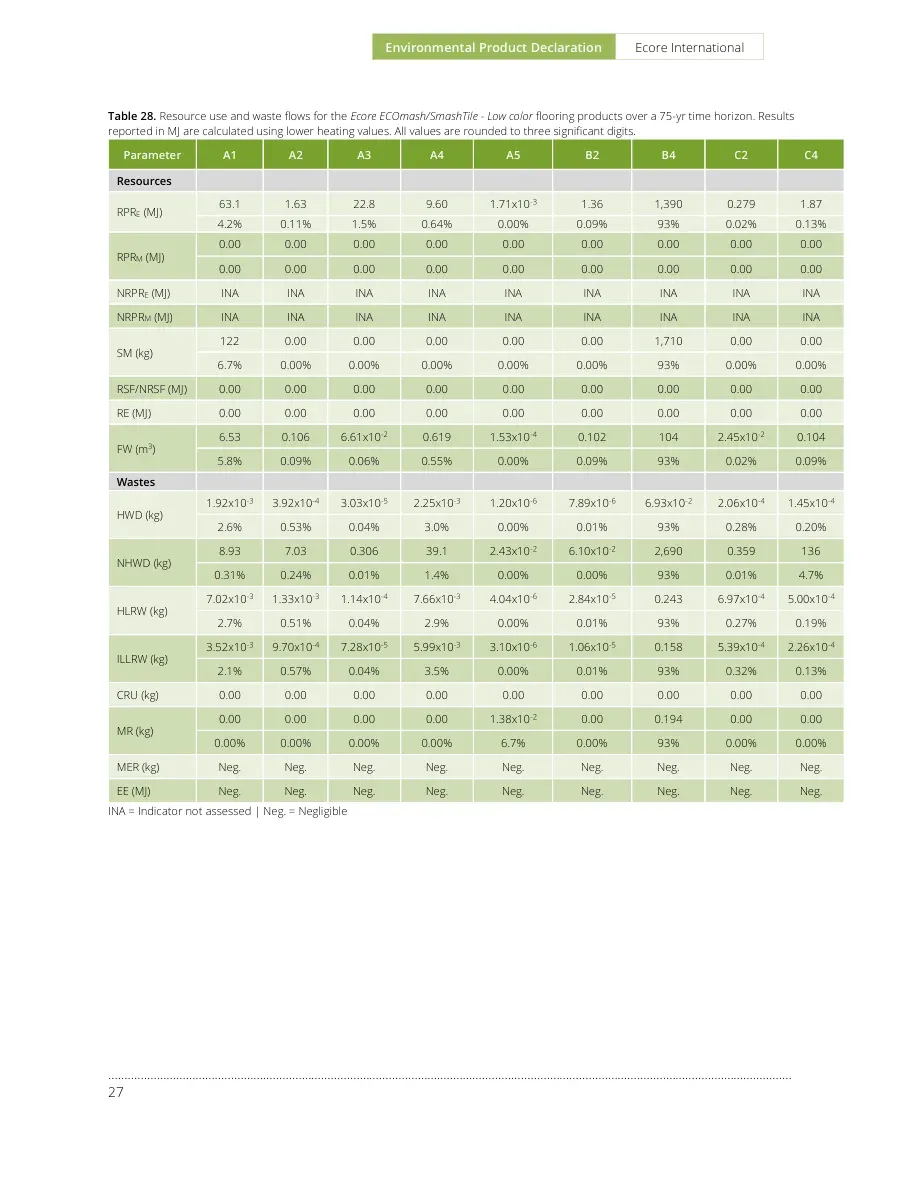
Environmental Product Declaration Ecore International ………………………………………………………………………………………………..………………………………………………………………………………………… 27 Table 28. Resource use and waste flows for the Ecore ECOmash/SmashTile - Low color flooring products over a 75-yr time horizon. Results reported in MJ are calculated using lower heating values. All values are rounded to three significant digits. Parameter A1 A2 A3 A4 A5 B2 B4 C2 C4 Resources RPRE (MJ) 63.1 1.63 22.8 9.60 1.71x10⁻³ 1.36 1,390 0.279 1.87 4.2% 0.11% 1.5% 0.64% 0.00% 0.09% 93% 0.02% 0.13% RPRM (MJ) 0.00 0.00 0.00 0.00 0.00 0.00 0.00 0.00 0.00 0.00 0.00 0.00 0.00 0.00 0.00 0.00 0.00 0.00 NRPRE (MJ) INA INA INA INA INA INA INA INA INA NRPRM (MJ) INA INA INA INA INA INA INA INA INA SM (kg) 122 0.00 0.00 0.00 0.00 0.00 1,710 0.00 0.00 6.7% 0.00% 0.00% 0.00% 0.00% 0.00% 93% 0.00% 0.00% RSF/NRSF (MJ) 0.00 0.00 0.00 0.00 0.00 0.00 0.00 0.00 0.00 RE (MJ) 0.00 0.00 0.00 0.00 0.00 0.00 0.00 0.00 0.00 FW (m3) 6.53 0.106 6.61x10⁻² 0.619 1.53x10⁻⁴ 0.102 104 2.45x10⁻² 0.104 5.8% 0.09% 0.06% 0.55% 0.00% 0.09% 93% 0.02% 0.09% Wastes HWD (kg) 1.92x10⁻³ 3.92x10⁻⁴ 3.03x10⁻⁵ 2.25x10⁻³ 1.20x10⁻⁶ 7.89x10⁻⁶ 6.93x10⁻² 2.06x10⁻⁴ 1.45x10⁻⁴ 2.6% 0.53% 0.04% 3.0% 0.00% 0.01% 93% 0.28% 0.20% NHWD (kg) 8.93 7.03 0.306 39.1 2.43x10⁻² 6.10x10⁻² 2,690 0.359 136 0.31% 0.24% 0.01% 1.4% 0.00% 0.00% 93% 0.01% 4.7% HLRW (kg) 7.02x10⁻³ 1.33x10⁻³ 1.14x10⁻⁴ 7.66x10⁻³ 4.04x10⁻⁶ 2.84x10⁻⁵ 0.243 6.97x10⁻⁴ 5.00x10⁻⁴ 2.7% 0.51% 0.04% 2.9% 0.00% 0.01% 93% 0.27% 0.19% ILLRW (kg) 3.52x10⁻³ 9.70x10⁻⁴ 7.28x10⁻⁵ 5.99x10⁻³ 3.10x10⁻⁶ 1.06x10⁻⁵ 0.158 5.39x10⁻⁴ 2.26x10⁻⁴ 2.1% 0.57% 0.04% 3.5% 0.00% 0.01% 93% 0.32% 0.13% CRU (kg) 0.00 0.00 0.00 0.00 0.00 0.00 0.00 0.00 0.00 MR (kg) 0.00 0.00 0.00 0.00 1.38x10⁻² 0.00 0.194 0.00 0.00 0.00% 0.00% 0.00% 0.00% 6.7% 0.00% 93% 0.00% 0.00% MER (kg) Neg. Neg. Neg. Neg. Neg. Neg. Neg. Neg. Neg. EE (MJ) Neg. Neg. Neg. Neg. Neg. Neg. Neg. Neg. Neg. INA = Indicator not assessed | Neg. = Negligible
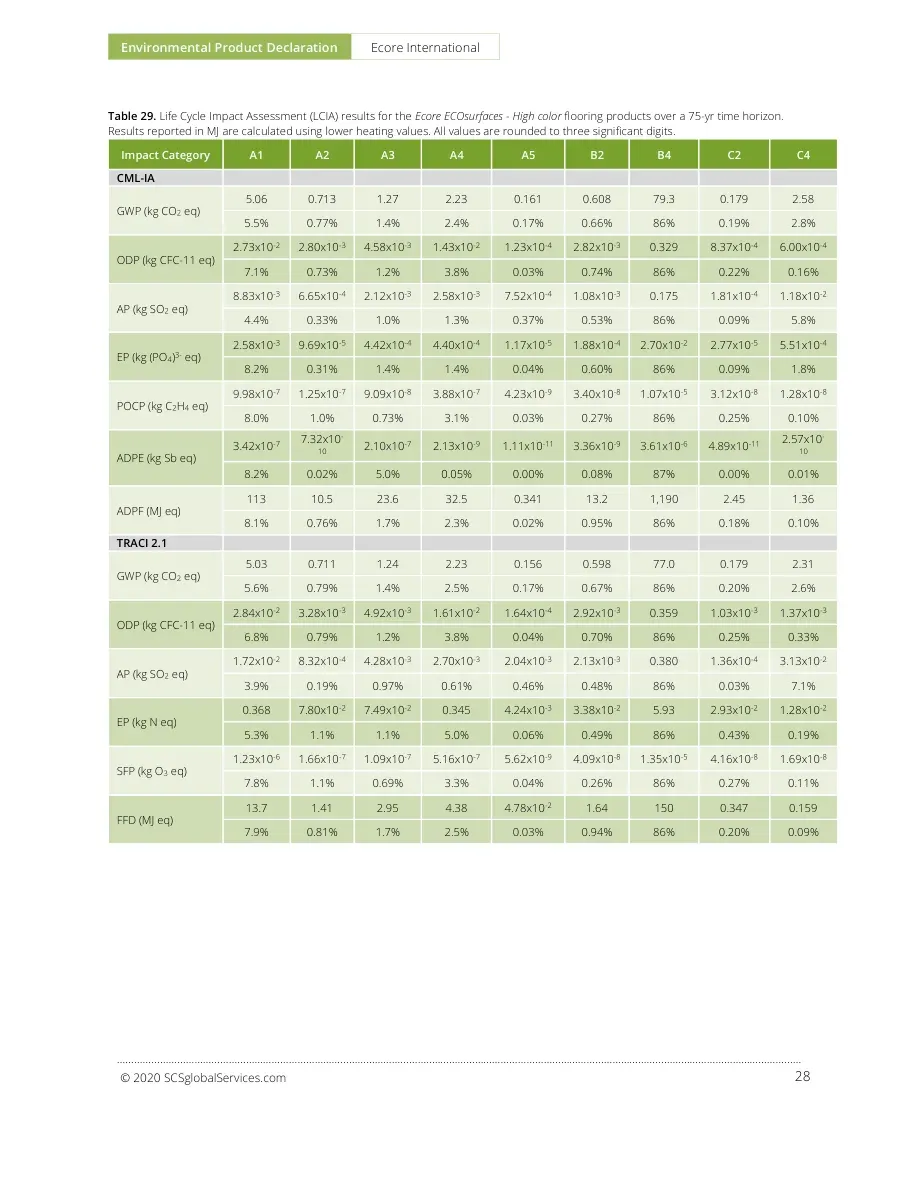
Environmental Product Declaration Ecore International ………………………………………………………………………………………………..………………………………………………………………………………………………………………… 28 © 2020 SCSglobalServices.com Table 29. Life Cycle Impact Assessment (LCIA) results for the Ecore ECOsurfaces - High color flooring products over a 75-yr time horizon. Results reported in MJ are calculated using lower heating values. All values are rounded to three significant digits. Impact Category A1 A2 A3 A4 A5 B2 B4 C2 C4 CML-IA GWP (kg CO2 eq) 5.06 0.713 1.27 2.23 0.161 0.608 79.3 0.179 2.58 5.5% 0.77% 1.4% 2.4% 0.17% 0.66% 86% 0.19% 2.8% ODP (kg CFC-11 eq) 2.73x10⁻² 2.80x10⁻³ 4.58x10⁻³ 1.43x10⁻² 1.23x10⁻⁴ 2.82x10⁻³ 0.329 8.37x10⁻⁴ 6.00x10⁻⁴ 7.1% 0.73% 1.2% 3.8% 0.03% 0.74% 86% 0.22% 0.16% AP (kg SO2 eq) 8.83x10⁻³ 6.65x10⁻⁴ 2.12x10⁻³ 2.58x10⁻³ 7.52x10⁻⁴ 1.08x10⁻³ 0.175 1.81x10⁻⁴ 1.18x10⁻² 4.4% 0.33% 1.0% 1.3% 0.37% 0.53% 86% 0.09% 5.8% EP (kg (PO4)3- eq) 2.58x10⁻³ 9.69x10⁻⁵ 4.42x10⁻⁴ 4.40x10⁻⁴ 1.17x10⁻⁵ 1.88x10⁻⁴ 2.70x10⁻² 2.77x10⁻⁵ 5.51x10⁻⁴ 8.2% 0.31% 1.4% 1.4% 0.04% 0.60% 86% 0.09% 1.8% POCP (kg C2H4 eq) 9.98x10⁻⁷ 1.25x10⁻⁷ 9.09x10⁻⁸ 3.88x10⁻⁷ 4.23x10⁻⁹ 3.40x10⁻⁸ 1.07x10⁻⁵ 3.12x10⁻⁸ 1.28x10⁻⁸ 8.0% 1.0% 0.73% 3.1% 0.03% 0.27% 86% 0.25% 0.10% ADPE (kg Sb eq) 3.42x10⁻⁷ 7.32x10⁻¹⁰ 2.10x10⁻⁷ 2.13x10⁻⁹ 1.11x10⁻¹¹ 3.36x10⁻⁹ 3.61x10⁻⁶ 4.89x10⁻¹¹ 2.57x10⁻¹⁰ 8.2% 0.02% 5.0% 0.05% 0.00% 0.08% 87% 0.00% 0.01% ADPF (MJ eq) 113 10.5 23.6 32.5 0.341 13.2 1,190 2.45 1.36 8.1% 0.76% 1.7% 2.3% 0.02% 0.95% 86% 0.18% 0.10% TRACI 2.1 GWP (kg CO2 eq) 5.03 0.711 1.24 2.23 0.156 0.598 77.0 0.179 2.31 5.6% 0.79% 1.4% 2.5% 0.17% 0.67% 86% 0.20% 2.6% ODP (kg CFC-11 eq) 2.84x10⁻² 3.28x10⁻³ 4.92x10⁻³ 1.61x10⁻² 1.64x10⁻⁴ 2.92x10⁻³ 0.359 1.03x10⁻³ 1.37x10⁻³ 6.8% 0.79% 1.2% 3.8% 0.04% 0.70% 86% 0.25% 0.33% AP (kg SO2 eq) 1.72x10⁻² 8.32x10⁻⁴ 4.28x10⁻³ 2.70x10⁻³ 2.04x10⁻³ 2.13x10⁻³ 0.380 1.36x10⁻⁴ 3.13x10⁻² 3.9% 0.19% 0.97% 0.61% 0.46% 0.48% 86% 0.03% 7.1% EP (kg N eq) 0.368 7.80x10⁻² 7.49x10⁻² 0.345 4.24x10⁻³ 3.38x10⁻² 5.93 2.93x10⁻² 1.28x10⁻² 5.3% 1.1% 1.1% 5.0% 0.06% 0.49% 86% 0.43% 0.19% SFP (kg O3 eq) 1.23x10⁻⁶ 1.66x10⁻⁷ 1.09x10⁻⁷ 5.16x10⁻⁷ 5.62x10⁻⁹ 4.09x10⁻⁸ 1.35x10⁻⁵ 4.16x10⁻⁸ 1.69x10⁻⁸ 7.8% 1.1% 0.69% 3.3% 0.04% 0.26% 86% 0.27% 0.11% FFD (MJ eq) 13.7 1.41 2.95 4.38 4.78x10⁻² 1.64 150 0.347 0.159 7.9% 0.81% 1.7% 2.5% 0.03% 0.94% 86% 0.20% 0.09%

Environmental Product Declaration Ecore International ………………………………………………………………………………………………..………………………………………………………………………………………… 29 Table 30. Resource use and waste flows for the Ecore ECOsurfaces - High color flooring products over a 75-yr time horizon. Results reported in MJ are calculated using lower heating values. All values are rounded to three significant digits. Parameter A1 A2 A3 A4 A5 B2 B4 C2 C4 Resources RPRE (MJ) 4.11 0.117 11.9 0.346 2.17x10⁻³ 1.28 107 9.03x10⁻³ 6.03x10⁻² 3.3% 0.09% 9.5% 0.28% 0.00% 1.0% 86% 0.01% 0.05% RPRM (MJ) 0.00 0.00 0.00 0.00 0.00 0.00 0.00 0.00 0.00 0.00 0.00 0.00 0.00 0.00 0.00 0.00 0.00 0.00 NRPRE (MJ) INA INA INA INA INA INA INA INA INA NRPRM (MJ) INA INA INA INA INA INA INA INA INA SM (kg) 0.744 0.00 0.00 0.00 0.00 0.00 4.84 0.00 0.00 13% 0.00% 0.00% 0.00% 0.00% 0.00% 87% 0.00% 0.00% RSF/NRSF (MJ) 0.00 0.00 0.00 0.00 0.00 0.00 0.00 0.00 0.00 RE (MJ) 0.00 0.00 0.00 0.00 0.00 0.00 0.00 0.00 0.00 FW (m3) 0.329 7.58x10⁻³ 9.78x10⁻² 2.23x10⁻² 2.09x10⁻⁴ 9.85x10⁻² 3.00 7.94x10⁻⁴ 3.37x10⁻³ 9.3% 0.21% 2.7% 0.63% 0.01% 2.8% 84% 0.02% 0.09% Wastes HWD (kg) 1.12x10⁻⁴ 2.81x10⁻⁵ 2.70x10⁻⁵ 8.12x10⁻⁵ 9.58x10⁻⁷ 7.42x10⁻⁶ 1.69x10⁻³ 6.66x10⁻⁶ 4.68x10⁻⁶ 5.7% 1.4% 1.4% 4.1% 0.05% 0.38% 86% 0.34% 0.24% NHWD (kg) 0.504 0.504 0.311 1.41 0.149 5.74x10⁻² 47.1 1.16x10⁻² 4.35 0.93% 0.93% 0.57% 2.6% 0.27% 0.11% 87% 0.02% 8.0% HLRW (kg) 3.98x10⁻⁴ 9.55x10⁻⁵ 1.05x10⁻⁴ 2.76x10⁻⁴ 3.24x10⁻⁶ 2.67x10⁻⁵ 5.95x10⁻³ 2.25x10⁻⁵ 1.61x10⁻⁵ 5.8% 1.4% 1.5% 4.0% 0.05% 0.39% 86% 0.33% 0.23% ILLRW (kg) 3.97x10⁻⁴ 6.96x10⁻⁵ 7.66x10⁻⁵ 2.16x10⁻⁴ 2.33x10⁻⁶ 9.99x10⁻⁶ 5.11x10⁻³ 1.74x10⁻⁵ 7.23x10⁻⁶ 6.7% 1.2% 1.3% 3.7% 0.04% 0.17% 87% 0.29% 0.12% CRU (kg) 0.00 0.00 0.00 0.00 0.00 0.00 0.00 0.00 0.00 MR (kg) 0.00 0.00 0.00 0.00 8.91x10⁻² 0.00 0.579 0.00 0.00 0.00% 0.00% 0.00% 0.00% 13% 0.00% 87% 0.00% 0.00% MER (kg) Neg. Neg. Neg. Neg. Neg. Neg. Neg. Neg. Neg. EE (MJ) Neg. Neg. Neg. Neg. Neg. Neg. Neg. Neg. Neg. INA = Indicator not assessed | Neg. = Negligible

Environmental Product Declaration Ecore International ………………………………………………………………………………………………..………………………………………………………………………………………………………………… 30 © 2020 SCSglobalServices.com Table 31. Life Cycle Impact Assessment (LCIA) results for the Ecore ECOsurfaces - Low color flooring products over a 75-yr time horizon. Results reported in MJ are calculated using lower heating values. All values are rounded to three significant digits. Impact Category A1 A2 A3 A4 A5 B2 B4 C2 C4 CML-IA GWP (kg CO2 eq) 4.13 0.401 1.27 2.23 0.161 0.608 70.9 0.179 2.53 5.0% 0.49% 1.5% 2.7% 0.20% 0.74% 86% 0.22% 3.1% ODP (kg CFC-11 eq) 2.13x10⁻² 1.58x10⁻³ 4.58x10⁻³ 1.43x10⁻² 1.23x10⁻⁴ 2.82x10⁻³ 0.282 8.37x10⁻⁴ 5.93x10⁻⁴ 6.5% 0.48% 1.4% 4.4% 0.04% 0.86% 86% 0.26% 0.18% AP (kg SO2 eq) 8.95x10⁻³ 3.74x10⁻⁴ 2.12x10⁻³ 2.58x10⁻³ 7.52x10⁻⁴ 1.08x10⁻³ 0.175 1.81x10⁻⁴ 1.19x10⁻² 4.4% 0.18% 1.0% 1.3% 0.37% 0.53% 86% 0.09% 5.9% EP (kg (PO4)3- eq) 2.54x10⁻³ 5.46x10⁻⁵ 4.42x10⁻⁴ 4.40x10⁻⁴ 1.17x10⁻⁵ 1.88x10⁻⁴ 2.63x10⁻² 2.77x10⁻⁵ 5.41x10⁻⁴ 8.3% 0.18% 1.4% 1.4% 0.04% 0.61% 86% 0.09% 1.8% POCP (kg C2H4 eq) 6.33x10⁻⁷ 7.04x10⁻⁸ 9.09x10⁻⁸ 3.88x10⁻⁷ 4.23x10⁻⁹ 3.40x10⁻⁸ 8.00x10⁻⁶ 3.12x10⁻⁸ 1.27x10⁻⁸ 6.8% 0.76% 0.98% 4.2% 0.05% 0.37% 86% 0.34% 0.14% ADPE (kg Sb eq) 1.95x10⁻⁷ 4.12x10⁻¹⁰ 2.10x10⁻⁷ 2.13x10⁻⁹ 1.11x10⁻¹¹ 3.36x10⁻⁹ 2.65x10⁻⁶ 4.89x10⁻¹¹ 2.54x10⁻¹⁰ 6.4% 0.01% 6.9% 0.07% 0.00% 0.11% 87% 0.00% 0.01% ADPF (MJ eq) 67.0 5.92 23.6 32.5 0.341 13.2 866 2.45 1.35 6.6% 0.59% 2.3% 3.2% 0.03% 1.3% 86% 0.24% 0.13% TRACI 2.1 GWP (kg CO2 eq) 4.12 0.400 1.24 2.23 0.156 0.598 68.8 0.179 2.27 5.1% 0.50% 1.6% 2.8% 0.20% 0.75% 86% 0.22% 2.8% ODP (kg CFC-11 eq) 2.16x10⁻² 1.85x10⁻³ 4.92x10⁻³ 1.61x10⁻² 1.64x10⁻⁴ 2.92x10⁻³ 0.306 1.03x10⁻³ 1.37x10⁻³ 6.1% 0.52% 1.4% 4.5% 0.05% 0.82% 86% 0.29% 0.38% AP (kg SO2 eq) 1.77x10⁻² 4.68x10⁻⁴ 4.28x10⁻³ 2.70x10⁻³ 2.04x10⁻³ 2.13x10⁻³ 0.383 1.36x10⁻⁴ 3.17x10⁻² 4.0% 0.11% 0.96% 0.61% 0.46% 0.48% 86% 0.03% 7.1% EP (kg N eq) 0.296 4.39x10⁻² 7.49x10⁻² 0.345 4.24x10⁻³ 3.38x10⁻² 5.24 2.93x10⁻² 1.27x10⁻² 4.9% 0.72% 1.2% 5.7% 0.07% 0.56% 86% 0.48% 0.21% SFP (kg O3 eq) 7.27x10⁻⁷ 9.37x10⁻⁸ 1.09x10⁻⁷ 5.16x10⁻⁷ 5.62x10⁻⁹ 4.09x10⁻⁸ 9.81x10⁻⁶ 4.16x10⁻⁸ 1.68x10⁻⁸ 6.4% 0.82% 0.96% 4.5% 0.05% 0.36% 86% 0.37% 0.15% FFD (MJ eq) 7.17 0.796 2.95 4.38 4.78x10⁻² 1.64 103 0.347 0.158 5.9% 0.66% 2.5% 3.6% 0.04% 1.4% 85% 0.29% 0.13%
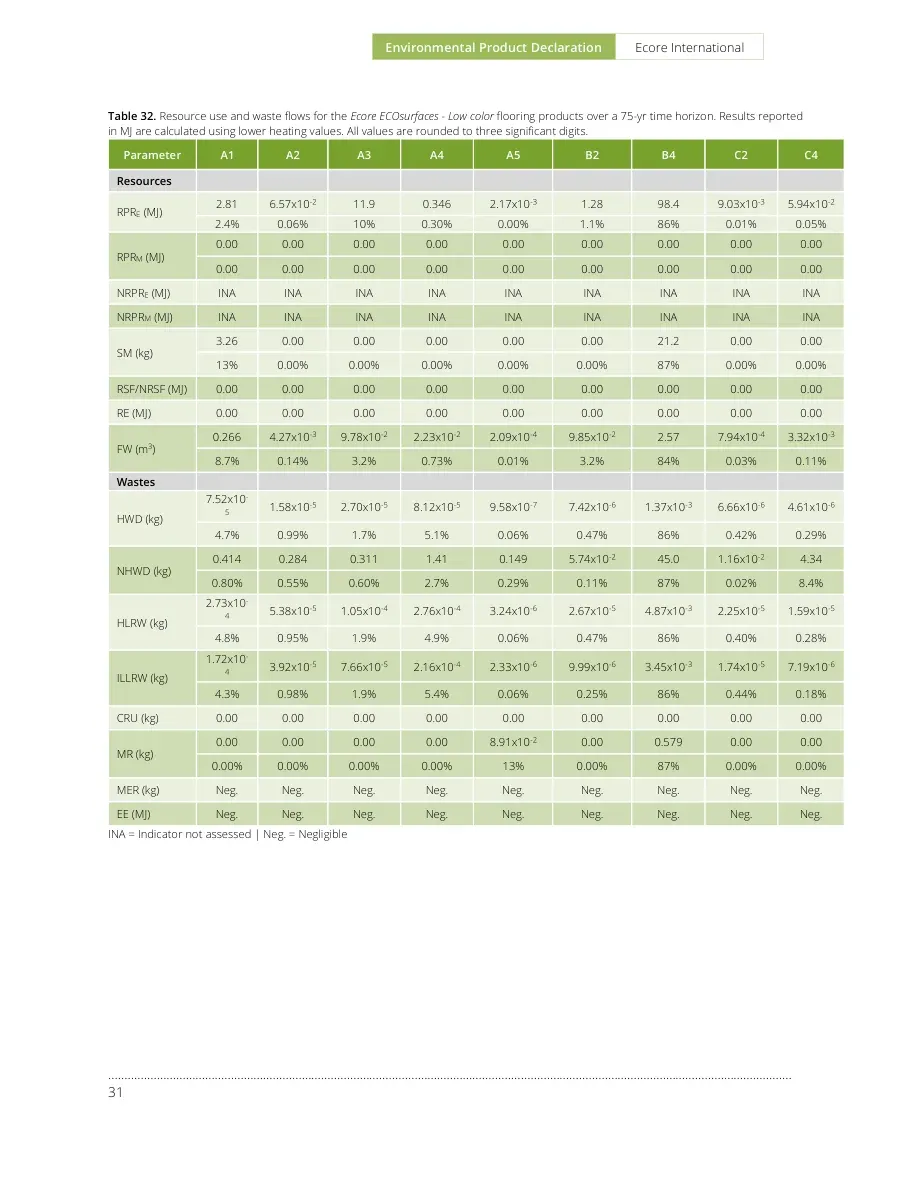
Environmental Product Declaration Ecore International ………………………………………………………………………………………………..………………………………………………………………………………………… 31 Table 32. Resource use and waste flows for the Ecore ECOsurfaces - Low color flooring products over a 75-yr time horizon. Results reported in MJ are calculated using lower heating values. All values are rounded to three significant digits. Parameter A1 A2 A3 A4 A5 B2 B4 C2 C4 Resources RPRE (MJ) 2.81 6.57x10⁻² 11.9 0.346 2.17x10⁻³ 1.28 98.4 9.03x10⁻³ 5.94x10⁻² 2.4% 0.06% 10% 0.30% 0.00% 1.1% 86% 0.01% 0.05% RPRM (MJ) 0.00 0.00 0.00 0.00 0.00 0.00 0.00 0.00 0.00 0.00 0.00 0.00 0.00 0.00 0.00 0.00 0.00 0.00 NRPRE (MJ) INA INA INA INA INA INA INA INA INA NRPRM (MJ) INA INA INA INA INA INA INA INA INA SM (kg) 3.26 0.00 0.00 0.00 0.00 0.00 21.2 0.00 0.00 13% 0.00% 0.00% 0.00% 0.00% 0.00% 87% 0.00% 0.00% RSF/NRSF (MJ) 0.00 0.00 0.00 0.00 0.00 0.00 0.00 0.00 0.00 RE (MJ) 0.00 0.00 0.00 0.00 0.00 0.00 0.00 0.00 0.00 FW (m3) 0.266 4.27x10⁻³ 9.78x10⁻² 2.23x10⁻² 2.09x10⁻⁴ 9.85x10⁻² 2.57 7.94x10⁻⁴ 3.32x10⁻³ 8.7% 0.14% 3.2% 0.73% 0.01% 3.2% 84% 0.03% 0.11% Wastes HWD (kg) 7.52x10⁻⁵ 1.58x10⁻⁵ 2.70x10⁻⁵ 8.12x10⁻⁵ 9.58x10⁻⁷ 7.42x10⁻⁶ 1.37x10⁻³ 6.66x10⁻⁶ 4.61x10⁻⁶ 4.7% 0.99% 1.7% 5.1% 0.06% 0.47% 86% 0.42% 0.29% NHWD (kg) 0.414 0.284 0.311 1.41 0.149 5.74x10⁻² 45.0 1.16x10⁻² 4.34 0.80% 0.55% 0.60% 2.7% 0.29% 0.11% 87% 0.02% 8.4% HLRW (kg) 2.73x10⁻⁴ 5.38x10⁻⁵ 1.05x10⁻⁴ 2.76x10⁻⁴ 3.24x10⁻⁶ 2.67x10⁻⁵ 4.87x10⁻³ 2.25x10⁻⁵ 1.59x10⁻⁵ 4.8% 0.95% 1.9% 4.9% 0.06% 0.47% 86% 0.40% 0.28% ILLRW (kg) 1.72x10⁻⁴ 3.92x10⁻⁵ 7.66x10⁻⁵ 2.16x10⁻⁴ 2.33x10⁻⁶ 9.99x10⁻⁶ 3.45x10⁻³ 1.74x10⁻⁵ 7.19x10⁻⁶ 4.3% 0.98% 1.9% 5.4% 0.06% 0.25% 86% 0.44% 0.18% CRU (kg) 0.00 0.00 0.00 0.00 0.00 0.00 0.00 0.00 0.00 MR (kg) 0.00 0.00 0.00 0.00 8.91x10⁻² 0.00 0.579 0.00 0.00 0.00% 0.00% 0.00% 0.00% 13% 0.00% 87% 0.00% 0.00% MER (kg) Neg. Neg. Neg. Neg. Neg. Neg. Neg. Neg. Neg. EE (MJ) Neg. Neg. Neg. Neg. Neg. Neg. Neg. Neg. Neg. INA = Indicator not assessed | Neg. = Negligible
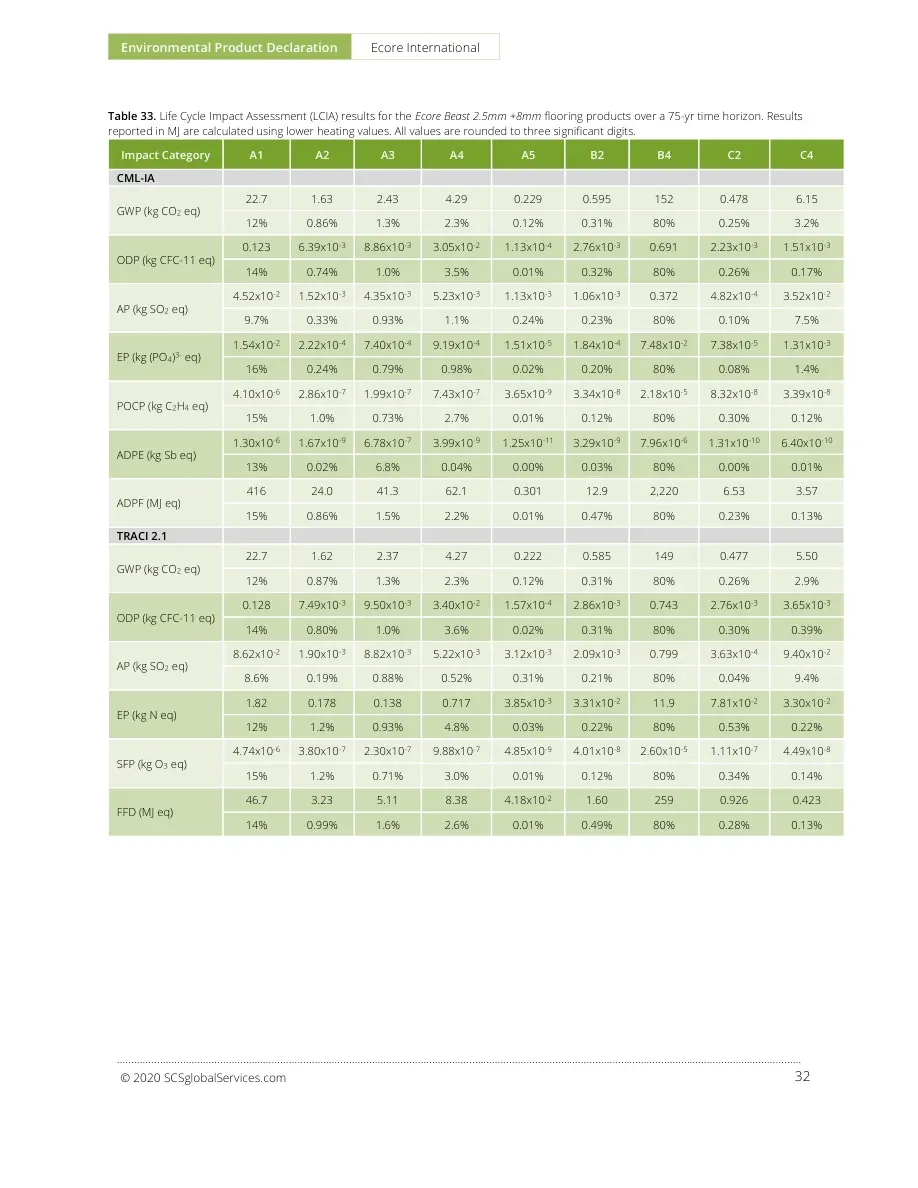
Environmental Product Declaration Ecore International ………………………………………………………………………………………………..………………………………………………………………………………………………………………… 32 © 2020 SCSglobalServices.com Table 33. Life Cycle Impact Assessment (LCIA) results for the Ecore Beast 2.5mm +8mm flooring products over a 75-yr time horizon. Results reported in MJ are calculated using lower heating values. All values are rounded to three significant digits. Impact Category A1 A2 A3 A4 A5 B2 B4 C2 C4 CML-IA GWP (kg CO2 eq) 22.7 1.63 2.43 4.29 0.229 0.595 152 0.478 6.15 12% 0.86% 1.3% 2.3% 0.12% 0.31% 80% 0.25% 3.2% ODP (kg CFC-11 eq) 0.123 6.39x10⁻³ 8.86x10⁻³ 3.05x10⁻² 1.13x10⁻⁴ 2.76x10⁻³ 0.691 2.23x10⁻³ 1.51x10⁻³ 14% 0.74% 1.0% 3.5% 0.01% 0.32% 80% 0.26% 0.17% AP (kg SO2 eq) 4.52x10⁻² 1.52x10⁻³ 4.35x10⁻³ 5.23x10⁻³ 1.13x10⁻³ 1.06x10⁻³ 0.372 4.82x10⁻⁴ 3.52x10⁻² 9.7% 0.33% 0.93% 1.1% 0.24% 0.23% 80% 0.10% 7.5% EP (kg (PO4)3- eq) 1.54x10⁻² 2.22x10⁻⁴ 7.40x10⁻⁴ 9.19x10⁻⁴ 1.51x10⁻⁵ 1.84x10⁻⁴ 7.48x10⁻² 7.38x10⁻⁵ 1.31x10⁻³ 16% 0.24% 0.79% 0.98% 0.02% 0.20% 80% 0.08% 1.4% POCP (kg C2H4 eq) 4.10x10⁻⁶ 2.86x10⁻⁷ 1.99x10⁻⁷ 7.43x10⁻⁷ 3.65x10⁻⁹ 3.34x10⁻⁸ 2.18x10⁻⁵ 8.32x10⁻⁸ 3.39x10⁻⁸ 15% 1.0% 0.73% 2.7% 0.01% 0.12% 80% 0.30% 0.12% ADPE (kg Sb eq) 1.30x10⁻⁶ 1.67x10⁻⁹ 6.78x10⁻⁷ 3.99x10⁻⁹ 1.25x10⁻¹¹ 3.29x10⁻⁹ 7.96x10⁻⁶ 1.31x10⁻¹⁰ 6.40x10⁻¹⁰ 13% 0.02% 6.8% 0.04% 0.00% 0.03% 80% 0.00% 0.01% ADPF (MJ eq) 416 24.0 41.3 62.1 0.301 12.9 2,220 6.53 3.57 15% 0.86% 1.5% 2.2% 0.01% 0.47% 80% 0.23% 0.13% TRACI 2.1 GWP (kg CO2 eq) 22.7 1.62 2.37 4.27 0.222 0.585 149 0.477 5.50 12% 0.87% 1.3% 2.3% 0.12% 0.31% 80% 0.26% 2.9% ODP (kg CFC-11 eq) 0.128 7.49x10⁻³ 9.50x10⁻³ 3.40x10⁻² 1.57x10⁻⁴ 2.86x10⁻³ 0.743 2.76x10⁻³ 3.65x10⁻³ 14% 0.80% 1.0% 3.6% 0.02% 0.31% 80% 0.30% 0.39% AP (kg SO2 eq) 8.62x10⁻² 1.90x10⁻³ 8.82x10⁻³ 5.22x10⁻³ 3.12x10⁻³ 2.09x10⁻³ 0.799 3.63x10⁻⁴ 9.40x10⁻² 8.6% 0.19% 0.88% 0.52% 0.31% 0.21% 80% 0.04% 9.4% EP (kg N eq) 1.82 0.178 0.138 0.717 3.85x10⁻³ 3.31x10⁻² 11.9 7.81x10⁻² 3.30x10⁻² 12% 1.2% 0.93% 4.8% 0.03% 0.22% 80% 0.53% 0.22% SFP (kg O3 eq) 4.74x10⁻⁶ 3.80x10⁻⁷ 2.30x10⁻⁷ 9.88x10⁻⁷ 4.85x10⁻⁹ 4.01x10⁻⁸ 2.60x10⁻⁵ 1.11x10⁻⁷ 4.49x10⁻⁸ 15% 1.2% 0.71% 3.0% 0.01% 0.12% 80% 0.34% 0.14% FFD (MJ eq) 46.7 3.23 5.11 8.38 4.18x10⁻² 1.60 259 0.926 0.423 14% 0.99% 1.6% 2.6% 0.01% 0.49% 80% 0.28% 0.13%
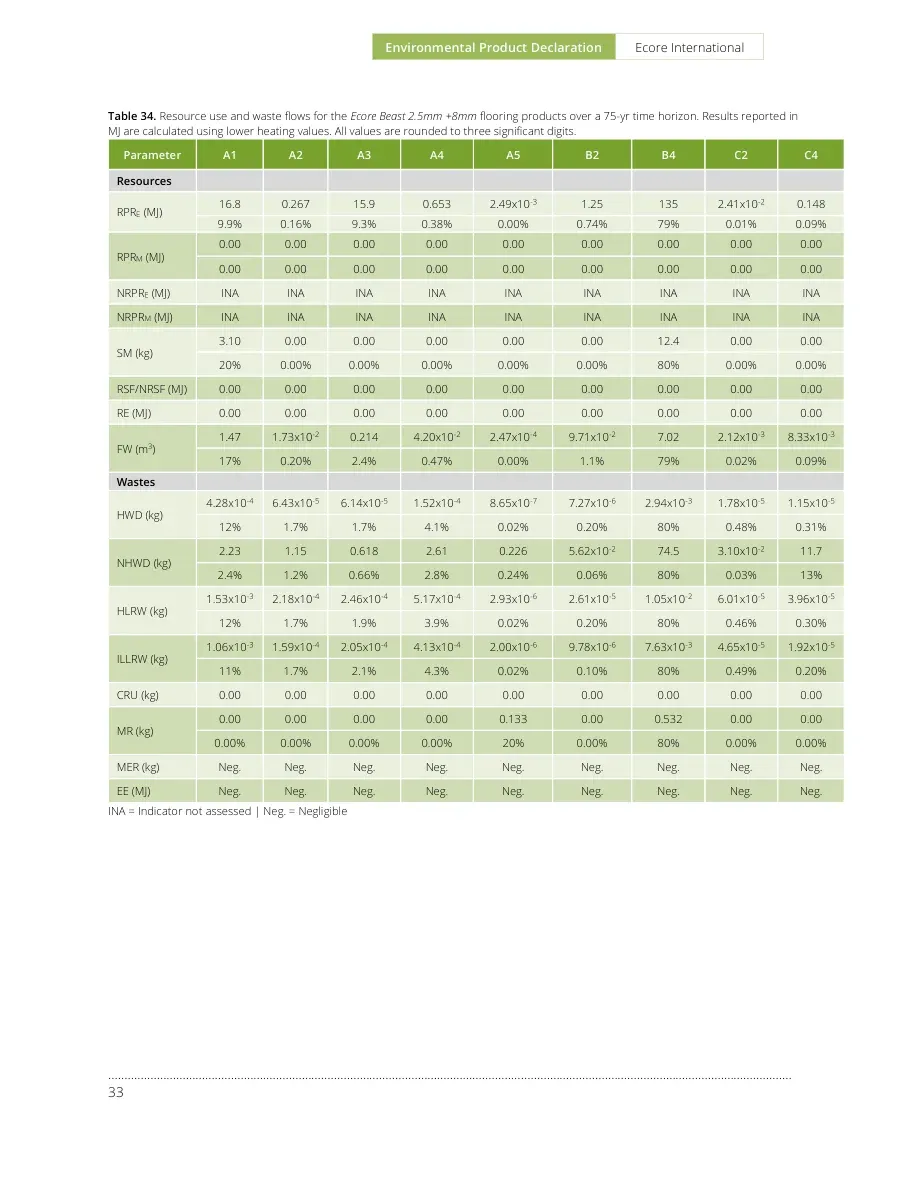
Environmental Product Declaration Ecore International ………………………………………………………………………………………………..………………………………………………………………………………………… 33 Table 34. Resource use and waste flows for the Ecore Beast 2.5mm +8mm flooring products over a 75-yr time horizon. Results reported in MJ are calculated using lower heating values. All values are rounded to three significant digits. Parameter A1 A2 A3 A4 A5 B2 B4 C2 C4 Resources RPRE (MJ) 16.8 0.267 15.9 0.653 2.49x10⁻³ 1.25 135 2.41x10⁻² 0.148 9.9% 0.16% 9.3% 0.38% 0.00% 0.74% 79% 0.01% 0.09% RPRM (MJ) 0.00 0.00 0.00 0.00 0.00 0.00 0.00 0.00 0.00 0.00 0.00 0.00 0.00 0.00 0.00 0.00 0.00 0.00 NRPRE (MJ) INA INA INA INA INA INA INA INA INA NRPRM (MJ) INA INA INA INA INA INA INA INA INA SM (kg) 3.10 0.00 0.00 0.00 0.00 0.00 12.4 0.00 0.00 20% 0.00% 0.00% 0.00% 0.00% 0.00% 80% 0.00% 0.00% RSF/NRSF (MJ) 0.00 0.00 0.00 0.00 0.00 0.00 0.00 0.00 0.00 RE (MJ) 0.00 0.00 0.00 0.00 0.00 0.00 0.00 0.00 0.00 FW (m3) 1.47 1.73x10⁻² 0.214 4.20x10⁻² 2.47x10⁻⁴ 9.71x10⁻² 7.02 2.12x10⁻³ 8.33x10⁻³ 17% 0.20% 2.4% 0.47% 0.00% 1.1% 79% 0.02% 0.09% Wastes HWD (kg) 4.28x10⁻⁴ 6.43x10⁻⁵ 6.14x10⁻⁵ 1.52x10⁻⁴ 8.65x10⁻⁷ 7.27x10⁻⁶ 2.94x10⁻³ 1.78x10⁻⁵ 1.15x10⁻⁵ 12% 1.7% 1.7% 4.1% 0.02% 0.20% 80% 0.48% 0.31% NHWD (kg) 2.23 1.15 0.618 2.61 0.226 5.62x10⁻² 74.5 3.10x10⁻² 11.7 2.4% 1.2% 0.66% 2.8% 0.24% 0.06% 80% 0.03% 13% HLRW (kg) 1.53x10⁻³ 2.18x10⁻⁴ 2.46x10⁻⁴ 5.17x10⁻⁴ 2.93x10⁻⁶ 2.61x10⁻⁵ 1.05x10⁻² 6.01x10⁻⁵ 3.96x10⁻⁵ 12% 1.7% 1.9% 3.9% 0.02% 0.20% 80% 0.46% 0.30% ILLRW (kg) 1.06x10⁻³ 1.59x10⁻⁴ 2.05x10⁻⁴ 4.13x10⁻⁴ 2.00x10⁻⁶ 9.78x10⁻⁶ 7.63x10⁻³ 4.65x10⁻⁵ 1.92x10⁻⁵ 11% 1.7% 2.1% 4.3% 0.02% 0.10% 80% 0.49% 0.20% CRU (kg) 0.00 0.00 0.00 0.00 0.00 0.00 0.00 0.00 0.00 MR (kg) 0.00 0.00 0.00 0.00 0.133 0.00 0.532 0.00 0.00 0.00% 0.00% 0.00% 0.00% 20% 0.00% 80% 0.00% 0.00% MER (kg) Neg. Neg. Neg. Neg. Neg. Neg. Neg. Neg. Neg. EE (MJ) Neg. Neg. Neg. Neg. Neg. Neg. Neg. Neg. Neg. INA = Indicator not assessed | Neg. = Negligible
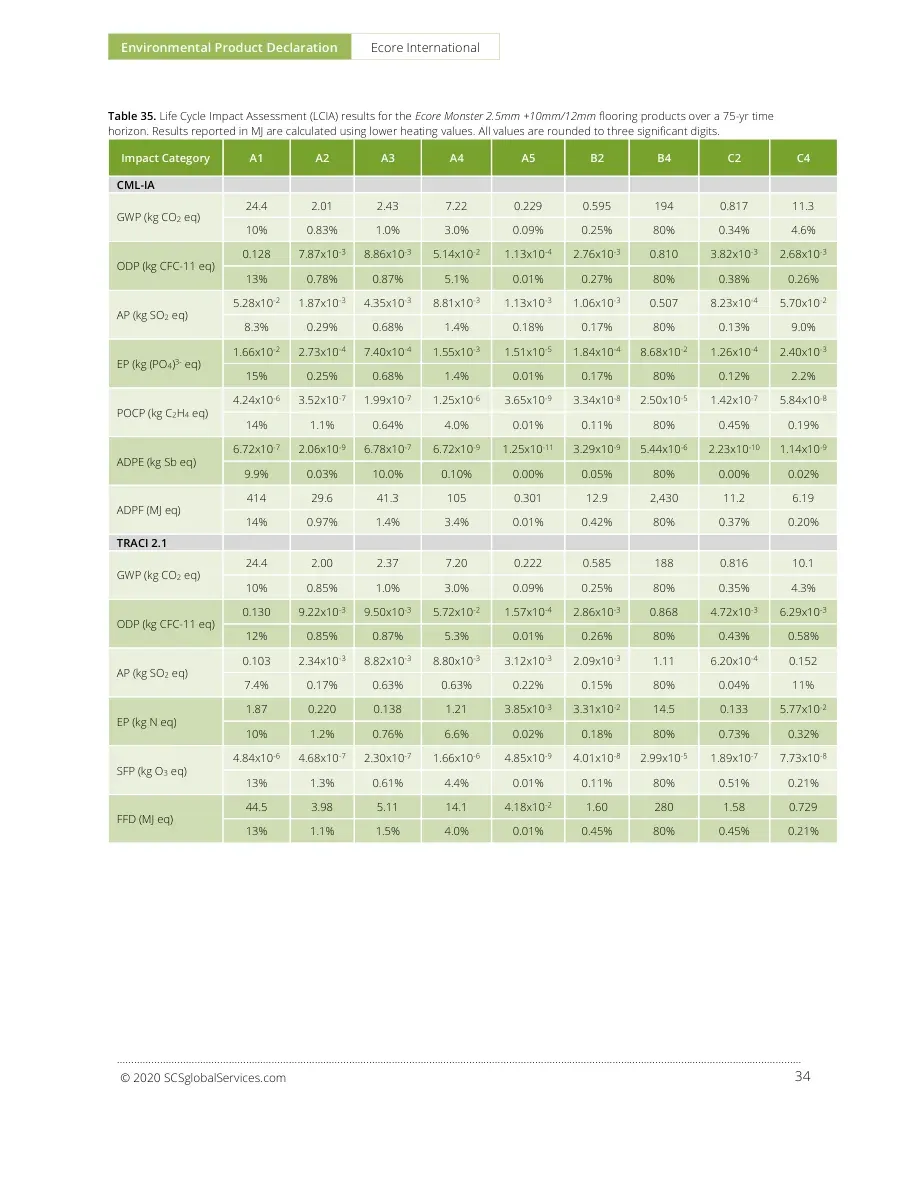
Environmental Product Declaration Ecore International ………………………………………………………………………………………………..………………………………………………………………………………………………………………… 34 © 2020 SCSglobalServices.com Table 35. Life Cycle Impact Assessment (LCIA) results for the Ecore Monster 2.5mm +10mm/12mm flooring products over a 75-yr time horizon. Results reported in MJ are calculated using lower heating values. All values are rounded to three significant digits. Impact Category A1 A2 A3 A4 A5 B2 B4 C2 C4 CML-IA GWP (kg CO2 eq) 24.4 2.01 2.43 7.22 0.229 0.595 194 0.817 11.3 10% 0.83% 1.0% 3.0% 0.09% 0.25% 80% 0.34% 4.6% ODP (kg CFC-11 eq) 0.128 7.87x10⁻³ 8.86x10⁻³ 5.14x10⁻² 1.13x10⁻⁴ 2.76x10⁻³ 0.810 3.82x10⁻³ 2.68x10⁻³ 13% 0.78% 0.87% 5.1% 0.01% 0.27% 80% 0.38% 0.26% AP (kg SO2 eq) 5.28x10⁻² 1.87x10⁻³ 4.35x10⁻³ 8.81x10⁻³ 1.13x10⁻³ 1.06x10⁻³ 0.507 8.23x10⁻⁴ 5.70x10⁻² 8.3% 0.29% 0.68% 1.4% 0.18% 0.17% 80% 0.13% 9.0% EP (kg (PO4)3- eq) 1.66x10⁻² 2.73x10⁻⁴ 7.40x10⁻⁴ 1.55x10⁻³ 1.51x10⁻⁵ 1.84x10⁻⁴ 8.68x10⁻² 1.26x10⁻⁴ 2.40x10⁻³ 15% 0.25% 0.68% 1.4% 0.01% 0.17% 80% 0.12% 2.2% POCP (kg C2H4 eq) 4.24x10⁻⁶ 3.52x10⁻⁷ 1.99x10⁻⁷ 1.25x10⁻⁶ 3.65x10⁻⁹ 3.34x10⁻⁸ 2.50x10⁻⁵ 1.42x10⁻⁷ 5.84x10⁻⁸ 14% 1.1% 0.64% 4.0% 0.01% 0.11% 80% 0.45% 0.19% ADPE (kg Sb eq) 6.72x10⁻⁷ 2.06x10⁻⁹ 6.78x10⁻⁷ 6.72x10⁻⁹ 1.25x10⁻¹¹ 3.29x10⁻⁹ 5.44x10⁻⁶ 2.23x10⁻¹⁰ 1.14x10⁻⁹ 9.9% 0.03% 10.0% 0.10% 0.00% 0.05% 80% 0.00% 0.02% ADPF (MJ eq) 414 29.6 41.3 105 0.301 12.9 2,430 11.2 6.19 14% 0.97% 1.4% 3.4% 0.01% 0.42% 80% 0.37% 0.20% TRACI 2.1 GWP (kg CO2 eq) 24.4 2.00 2.37 7.20 0.222 0.585 188 0.816 10.1 10% 0.85% 1.0% 3.0% 0.09% 0.25% 80% 0.35% 4.3% ODP (kg CFC-11 eq) 0.130 9.22x10⁻³ 9.50x10⁻³ 5.72x10⁻² 1.57x10⁻⁴ 2.86x10⁻³ 0.868 4.72x10⁻³ 6.29x10⁻³ 12% 0.85% 0.87% 5.3% 0.01% 0.26% 80% 0.43% 0.58% AP (kg SO2 eq) 0.103 2.34x10⁻³ 8.82x10⁻³ 8.80x10⁻³ 3.12x10⁻³ 2.09x10⁻³ 1.11 6.20x10⁻⁴ 0.152 7.4% 0.17% 0.63% 0.63% 0.22% 0.15% 80% 0.04% 11% EP (kg N eq) 1.87 0.220 0.138 1.21 3.85x10⁻³ 3.31x10⁻² 14.5 0.133 5.77x10⁻² 10% 1.2% 0.76% 6.6% 0.02% 0.18% 80% 0.73% 0.32% SFP (kg O3 eq) 4.84x10⁻⁶ 4.68x10⁻⁷ 2.30x10⁻⁷ 1.66x10⁻⁶ 4.85x10⁻⁹ 4.01x10⁻⁸ 2.99x10⁻⁵ 1.89x10⁻⁷ 7.73x10⁻⁸ 13% 1.3% 0.61% 4.4% 0.01% 0.11% 80% 0.51% 0.21% FFD (MJ eq) 44.5 3.98 5.11 14.1 4.18x10⁻² 1.60 280 1.58 0.729 13% 1.1% 1.5% 4.0% 0.01% 0.45% 80% 0.45% 0.21%

Environmental Product Declaration Ecore International ………………………………………………………………………………………………..………………………………………………………………………………………… 35 Table 36. Resource use and waste flows for the Ecore Monster 2.5mm +10mm/12mm flooring products over a 75-yr time horizon. Results reported in MJ are calculated using lower heating values. All values are rounded to three significant digits. Parameter A1 A2 A3 A4 A5 B2 B4 C2 C4 Resources RPRE (MJ) 17.1 0.329 15.9 1.10 2.49x10⁻³ 1.25 139 4.12x10⁻² 0.266 9.8% 0.19% 9.1% 0.63% 0.00% 0.72% 79% 0.02% 0.15% RPRM (MJ) 0.00 0.00 0.00 0.00 0.00 0.00 0.00 0.00 0.00 0.00 0.00 0.00 0.00 0.00 0.00 0.00 0.00 0.00 NRPRE (MJ) INA INA INA INA INA INA INA INA INA NRPRM (MJ) INA INA INA INA INA INA INA INA INA SM (kg) 12.8 0.00 0.00 0.00 0.00 0.00 51.1 0.00 0.00 20% 0.00% 0.00% 0.00% 0.00% 0.00% 80% 0.00% 0.00% RSF/NRSF (MJ) 0.00 0.00 0.00 0.00 0.00 0.00 0.00 0.00 0.00 RE (MJ) 0.00 0.00 0.00 0.00 0.00 0.00 0.00 0.00 0.00 FW (m3) 1.58 2.13x10⁻² 0.214 7.08x10⁻² 2.47x10⁻⁴ 9.71x10⁻² 7.63 3.62x10⁻³ 1.49x10⁻² 16% 0.22% 2.2% 0.73% 0.00% 1.0% 79% 0.04% 0.15% Wastes HWD (kg) 4.64x10⁻⁴ 7.92x10⁻⁵ 6.14x10⁻⁵ 2.56x10⁻⁴ 8.65x10⁻⁷ 7.27x10⁻⁶ 3.65x10⁻³ 3.04x10⁻⁵ 2.07x10⁻⁵ 10% 1.7% 1.3% 5.6% 0.02% 0.16% 80% 0.66% 0.45% NHWD (kg) 2.37 1.42 0.618 4.40 0.226 5.62x10⁻² 117 5.29x10⁻² 20.1 1.6% 0.97% 0.42% 3.0% 0.16% 0.04% 80% 0.04% 14% HLRW (kg) 1.67x10⁻³ 2.69x10⁻⁴ 2.46x10⁻⁴ 8.70x10⁻⁴ 2.93x10⁻⁶ 2.61x10⁻⁵ 1.29x10⁻² 1.03x10⁻⁴ 7.13x10⁻⁵ 10% 1.7% 1.5% 5.4% 0.02% 0.16% 80% 0.63% 0.44% ILLRW (kg) 1.05x10⁻³ 1.96x10⁻⁴ 2.05x10⁻⁴ 6.96x10⁻⁴ 2.00x10⁻⁶ 9.78x10⁻⁶ 9.06x10⁻³ 7.94x10⁻⁵ 3.31x10⁻⁵ 9.3% 1.7% 1.8% 6.1% 0.02% 0.09% 80% 0.70% 0.29% CRU (kg) 0.00 0.00 0.00 0.00 0.00 0.00 0.00 0.00 0.00 MR (kg) 0.00 0.00 0.00 0.00 0.133 0.00 0.532 0.00 0.00 0.00% 0.00% 0.00% 0.00% 20% 0.00% 80% 0.00% 0.00% MER (kg) Neg. Neg. Neg. Neg. Neg. Neg. Neg. Neg. Neg. EE (MJ) Neg. Neg. Neg. Neg. Neg. Neg. Neg. Neg. Neg. INA = Indicator not assessed | Neg. = Negligible
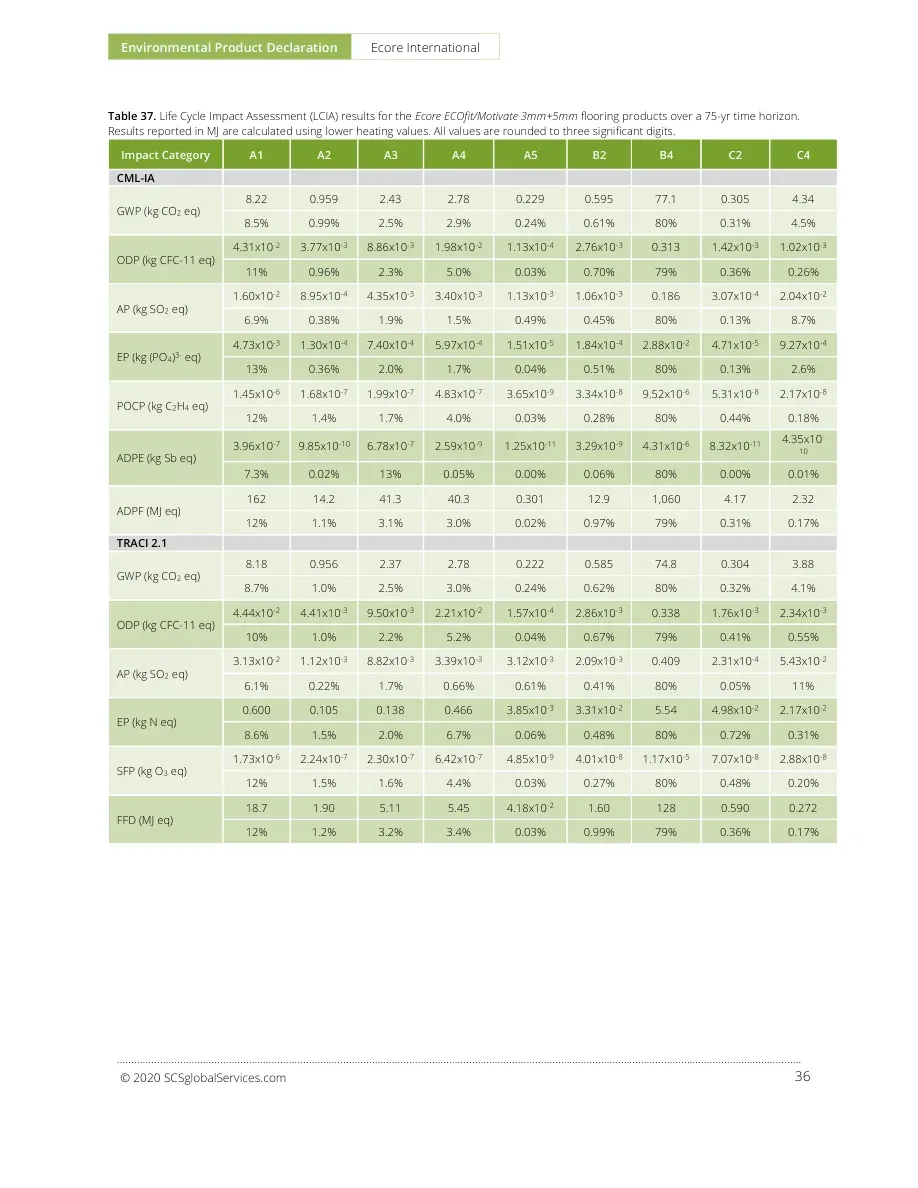
Environmental Product Declaration Ecore International ………………………………………………………………………………………………..………………………………………………………………………………………………………………… 36 © 2020 SCSglobalServices.com Table 37. Life Cycle Impact Assessment (LCIA) results for the Ecore ECOfit/Motivate 3mm+5mm flooring products over a 75-yr time horizon. Results reported in MJ are calculated using lower heating values. All values are rounded to three significant digits. Impact Category A1 A2 A3 A4 A5 B2 B4 C2 C4 CML-IA GWP (kg CO2 eq) 8.22 0.959 2.43 2.78 0.229 0.595 77.1 0.305 4.34 8.5% 0.99% 2.5% 2.9% 0.24% 0.61% 80% 0.31% 4.5% ODP (kg CFC-11 eq) 4.31x10⁻² 3.77x10⁻³ 8.86x10⁻³ 1.98x10⁻² 1.13x10⁻⁴ 2.76x10⁻³ 0.313 1.42x10⁻³ 1.02x10⁻³ 11% 0.96% 2.3% 5.0% 0.03% 0.70% 79% 0.36% 0.26% AP (kg SO2 eq) 1.60x10⁻² 8.95x10⁻⁴ 4.35x10⁻³ 3.40x10⁻³ 1.13x10⁻³ 1.06x10⁻³ 0.186 3.07x10⁻⁴ 2.04x10⁻² 6.9% 0.38% 1.9% 1.5% 0.49% 0.45% 80% 0.13% 8.7% EP (kg (PO4)3- eq) 4.73x10⁻³ 1.30x10⁻⁴ 7.40x10⁻⁴ 5.97x10⁻⁴ 1.51x10⁻⁵ 1.84x10⁻⁴ 2.88x10⁻² 4.71x10⁻⁵ 9.27x10⁻⁴ 13% 0.36% 2.0% 1.7% 0.04% 0.51% 80% 0.13% 2.6% POCP (kg C2H4 eq) 1.45x10⁻⁶ 1.68x10⁻⁷ 1.99x10⁻⁷ 4.83x10⁻⁷ 3.65x10⁻⁹ 3.34x10⁻⁸ 9.52x10⁻⁶ 5.31x10⁻⁸ 2.17x10⁻⁸ 12% 1.4% 1.7% 4.0% 0.03% 0.28% 80% 0.44% 0.18% ADPE (kg Sb eq) 3.96x10⁻⁷ 9.85x10⁻¹⁰ 6.78x10⁻⁷ 2.59x10⁻⁹ 1.25x10⁻¹¹ 3.29x10⁻⁹ 4.31x10⁻⁶ 8.32x10⁻¹¹ 4.35x10⁻¹⁰ 7.3% 0.02% 13% 0.05% 0.00% 0.06% 80% 0.00% 0.01% ADPF (MJ eq) 162 14.2 41.3 40.3 0.301 12.9 1,060 4.17 2.32 12% 1.1% 3.1% 3.0% 0.02% 0.97% 79% 0.31% 0.17% TRACI 2.1 GWP (kg CO2 eq) 8.18 0.956 2.37 2.78 0.222 0.585 74.8 0.304 3.88 8.7% 1.0% 2.5% 3.0% 0.24% 0.62% 80% 0.32% 4.1% ODP (kg CFC-11 eq) 4.44x10⁻² 4.41x10⁻³ 9.50x10⁻³ 2.21x10⁻² 1.57x10⁻⁴ 2.86x10⁻³ 0.338 1.76x10⁻³ 2.34x10⁻³ 10% 1.0% 2.2% 5.2% 0.04% 0.67% 79% 0.41% 0.55% AP (kg SO2 eq) 3.13x10⁻² 1.12x10⁻³ 8.82x10⁻³ 3.39x10⁻³ 3.12x10⁻³ 2.09x10⁻³ 0.409 2.31x10⁻⁴ 5.43x10⁻² 6.1% 0.22% 1.7% 0.66% 0.61% 0.41% 80% 0.05% 11% EP (kg N eq) 0.600 0.105 0.138 0.466 3.85x10⁻³ 3.31x10⁻² 5.54 4.98x10⁻² 2.17x10⁻² 8.6% 1.5% 2.0% 6.7% 0.06% 0.48% 80% 0.72% 0.31% SFP (kg O3 eq) 1.73x10⁻⁶ 2.24x10⁻⁷ 2.30x10⁻⁷ 6.42x10⁻⁷ 4.85x10⁻⁹ 4.01x10⁻⁸ 1.17x10⁻⁵ 7.07x10⁻⁸ 2.88x10⁻⁸ 12% 1.5% 1.6% 4.4% 0.03% 0.27% 80% 0.48% 0.20% FFD (MJ eq) 18.7 1.90 5.11 5.45 4.18x10⁻² 1.60 128 0.590 0.272 12% 1.2% 3.2% 3.4% 0.03% 0.99% 79% 0.36% 0.17%

Environmental Product Declaration Ecore International ………………………………………………………………………………………………..………………………………………………………………………………………… 37 Table 38. Resource use and waste flows for the Ecore ECOfit/Motivate 3mm+5mm flooring products over a 75-yr time horizon. Results reported in MJ are calculated using lower heating values. All values are rounded to three significant digits. Parameter A1 A2 A3 A4 A5 B2 B4 C2 C4 Resources RPRE (MJ) 6.17 0.157 15.9 0.424 2.49x10⁻³ 1.25 90.9 1.54x10⁻² 0.102 5.4% 0.14% 14% 0.37% 0.00% 1.1% 79% 0.01% 0.09% RPRM (MJ) 0.00 0.00 0.00 0.00 0.00 0.00 0.00 0.00 0.00 0.00 0.00 0.00 0.00 0.00 0.00 0.00 0.00 0.00 NRPRE (MJ) INA INA INA INA INA INA INA INA INA NRPRM (MJ) INA INA INA INA INA INA INA INA INA SM (kg) 3.26 0.00 0.00 0.00 0.00 0.00 13.1 0.00 0.00 20% 0.00% 0.00% 0.00% 0.00% 0.00% 80% 0.00% 0.00% RSF/NRSF (MJ) 0.00 0.00 0.00 0.00 0.00 0.00 0.00 0.00 0.00 RE (MJ) 0.00 0.00 0.00 0.00 0.00 0.00 0.00 0.00 0.00 FW (m3) 0.534 1.02x10⁻² 0.214 2.73x10⁻² 2.47x10⁻⁴ 9.71x10⁻² 3.17 1.35x10⁻³ 5.69x10⁻³ 13% 0.25% 5.3% 0.67% 0.01% 2.4% 78% 0.03% 0.14% Wastes HWD (kg) 1.67x10⁻⁴ 3.79x10⁻⁵ 6.14x10⁻⁵ 9.88x10⁻⁵ 8.65x10⁻⁷ 7.27x10⁻⁶ 1.54x10⁻³ 1.13x10⁻⁵ 7.90x10⁻⁶ 8.6% 2.0% 3.2% 5.1% 0.04% 0.38% 80% 0.59% 0.41% NHWD (kg) 0.818 0.678 0.618 1.70 0.226 5.62x10⁻² 46.0 1.97x10⁻² 7.43 1.4% 1.2% 1.1% 3.0% 0.39% 0.10% 80% 0.03% 13% HLRW (kg) 5.99x10⁻⁴ 1.29x10⁻⁴ 2.46x10⁻⁴ 3.36x10⁻⁴ 2.93x10⁻⁶ 2.61x10⁻⁵ 5.51x10⁻³ 3.83x10⁻⁵ 2.72x10⁻⁵ 8.7% 1.9% 3.6% 4.9% 0.04% 0.38% 80% 0.55% 0.39% ILLRW (kg) 4.84x10⁻⁴ 9.36x10⁻⁵ 2.05x10⁻⁴ 2.68x10⁻⁴ 2.00x10⁻⁶ 9.78x10⁻⁶ 4.38x10⁻³ 2.96x10⁻⁵ 1.23x10⁻⁵ 8.8% 1.7% 3.7% 4.9% 0.04% 0.18% 80% 0.54% 0.22% CRU (kg) 0.00 0.00 0.00 0.00 0.00 0.00 0.00 0.00 0.00 MR (kg) 0.00 0.00 0.00 0.00 0.133 0.00 0.532 0.00 0.00 0.00% 0.00% 0.00% 0.00% 20% 0.00% 80% 0.00% 0.00% MER (kg) Neg. Neg. Neg. Neg. Neg. Neg. Neg. Neg. Neg. EE (MJ) Neg. Neg. Neg. Neg. Neg. Neg. Neg. Neg. Neg. INA = Indicator not assessed | Neg. = Negligible

Environmental Product Declaration Ecore International ………………………………………………………………………………………………..………………………………………………………………………………………………………………… 38 © 2020 SCSglobalServices.com Table 39. Life Cycle Impact Assessment (LCIA) results for the Ecore ECOfit Plus/Rally- 3mm+12mm flooring products over a 75-yr time horizon. Results reported in MJ are calculated using lower heating values. All values are rounded to three significant digits. Impact Category A1 A2 A3 A4 A5 B2 B4 C2 C4 CML-IA GWP (kg CO2 eq) 10.8 1.17 2.27 4.21 0.182 0.595 103 0.466 6.66 8.3% 0.90% 1.8% 3.3% 0.14% 0.46% 80% 0.36% 5.2% ODP (kg CFC-11 eq) 5.63x10⁻² 4.58x10⁻³ 8.30x10⁻³ 3.00x10⁻² 1.20x10⁻⁴ 2.76x10⁻³ 0.412 2.18x10⁻³ 1.56x10⁻³ 11% 0.88% 1.6% 5.8% 0.02% 0.53% 80% 0.42% 0.30% AP (kg SO2 eq) 2.29x10⁻² 1.09x10⁻³ 4.13x10⁻³ 5.14x10⁻³ 8.72x10⁻⁴ 1.06x10⁻³ 0.264 4.70x10⁻⁴ 3.13x10⁻² 6.9% 0.33% 1.2% 1.6% 0.26% 0.32% 80% 0.14% 9.5% EP (kg (PO4)3- eq) 6.66x10⁻³ 1.59x10⁻⁴ 6.57x10⁻⁴ 9.03x10⁻⁴ 1.28x10⁻⁵ 1.84x10⁻⁴ 3.96x10⁻² 7.20x10⁻⁵ 1.42x10⁻³ 13% 0.32% 1.3% 1.8% 0.03% 0.37% 80% 0.15% 2.9% POCP (kg C2H4 eq) 1.82x10⁻⁶ 2.05x10⁻⁷ 1.98x10⁻⁷ 7.30x10⁻⁷ 4.05x10⁻⁹ 3.34x10⁻⁸ 1.23x10⁻⁵ 8.12x10⁻⁸ 3.34x10⁻⁸ 12% 1.3% 1.3% 4.7% 0.03% 0.22% 80% 0.53% 0.22% ADPE (kg Sb eq) 6.13x10⁻⁷ 1.20x10⁻⁹ 6.77x10⁻⁷ 3.92x10⁻⁹ 1.15x10⁻¹¹ 3.29x10⁻⁹ 5.18x10⁻⁶ 1.27x10⁻¹⁰ 6.67x10⁻¹⁰ 9.5% 0.02% 10% 0.06% 0.00% 0.05% 80% 0.00% 0.01% ADPF (MJ eq) 191 17.2 36.6 61.0 0.329 12.9 1,270 6.37 3.56 12% 1.1% 2.3% 3.8% 0.02% 0.81% 79% 0.40% 0.22% TRACI 2.1 GWP (kg CO2 eq) 10.8 1.16 2.21 4.20 0.177 0.585 99.7 0.466 5.95 8.6% 0.93% 1.8% 3.4% 0.14% 0.47% 80% 0.37% 4.8% ODP (kg CFC-11 eq) 5.79x10⁻² 5.37x10⁻³ 8.92x10⁻³ 3.34x10⁻² 1.62x10⁻⁴ 2.86x10⁻³ 0.448 2.69x10⁻³ 3.59x10⁻³ 10% 0.95% 1.6% 5.9% 0.03% 0.51% 80% 0.48% 0.64% AP (kg SO2 eq) 4.51x10⁻² 1.36x10⁻³ 8.37x10⁻³ 5.13x10⁻³ 2.38x10⁻³ 2.09x10⁻³ 0.584 3.54x10⁻⁴ 8.33x10⁻² 6.2% 0.19% 1.1% 0.70% 0.33% 0.29% 80% 0.05% 11% EP (kg N eq) 0.796 0.128 0.132 0.704 4.12x10⁻³ 3.31x10⁻² 7.50 7.61x10⁻² 3.33x10⁻² 8.5% 1.4% 1.4% 7.5% 0.04% 0.35% 80% 0.81% 0.35% SFP (kg O3 eq) 2.12x10⁻⁶ 2.72x10⁻⁷ 2.29x10⁻⁷ 9.71x10⁻⁷ 5.38x10⁻⁹ 4.01x10⁻⁸ 1.50x10⁻⁵ 1.08x10⁻⁷ 4.41x10⁻⁸ 11% 1.5% 1.2% 5.2% 0.03% 0.21% 80% 0.58% 0.24% FFD (MJ eq) 21.1 2.32 4.50 8.23 4.59x10⁻² 1.60 150 0.903 0.417 11% 1.2% 2.4% 4.4% 0.02% 0.85% 79% 0.48% 0.22%

Environmental Product Declaration Ecore International ………………………………………………………………………………………………..………………………………………………………………………………………… 39 Table 40. Resource use and waste flows for the Ecore ECOfit Plus/Rally- 3mm+12mm flooring products over a 75-yr time horizon. Results reported in MJ are calculated using lower heating values. All values are rounded to three significant digits. Parameter A1 A2 A3 A4 A5 B2 B4 C2 C4 Resources RPRE (MJ) 7.57 0.191 19.9 0.642 2.27x10⁻³ 1.25 114 2.35x10⁻² 0.156 5.3% 0.13% 14% 0.45% 0.00% 0.87% 79% 0.02% 0.11% RPRM (MJ) 0.00 0.00 0.00 0.00 0.00 0.00 0.00 0.00 0.00 0.00 0.00 0.00 0.00 0.00 0.00 0.00 0.00 0.00 NRPRE (MJ) INA INA INA INA INA INA INA INA INA NRPRM (MJ) INA INA INA INA INA INA INA INA INA SM (kg) 7.48 0.00 0.00 0.00 0.00 0.00 29.9 0.00 0.00 20% 0.00% 0.00% 0.00% 0.00% 0.00% 80% 0.00% 0.00% RSF/NRSF (MJ) 0.00 0.00 0.00 0.00 0.00 0.00 0.00 0.00 0.00 RE (MJ) 0.00 0.00 0.00 0.00 0.00 0.00 0.00 0.00 0.00 FW (m3) 0.699 1.24x10⁻² 0.200 4.13x10⁻² 2.21x10⁻⁴ 9.71x10⁻² 3.85 2.07x10⁻³ 8.73x10⁻³ 14% 0.25% 4.1% 0.84% 0.00% 2.0% 78% 0.04% 0.18% Wastes HWD (kg) 2.12x10⁻⁴ 4.61x10⁻⁵ 6.23x10⁻⁵ 1.49x10⁻⁴ 9.29x10⁻⁷ 7.27x10⁻⁶ 2.00x10⁻³ 1.73x10⁻⁵ 1.21x10⁻⁵ 8.5% 1.8% 2.5% 6.0% 0.04% 0.29% 80% 0.69% 0.48% NHWD (kg) 1.03 0.825 0.617 2.57 0.173 5.62x10⁻² 66.6 3.02x10⁻² 11.4 1.2% 0.99% 0.74% 3.1% 0.21% 0.07% 80% 0.04% 14% HLRW (kg) 7.67x10⁻⁴ 1.56x10⁻⁴ 2.49x10⁻⁴ 5.08x10⁻⁴ 3.15x10⁻⁶ 2.61x10⁻⁵ 7.13x10⁻³ 5.86x10⁻⁵ 4.18x10⁻⁵ 8.6% 1.7% 2.8% 5.7% 0.04% 0.29% 80% 0.66% 0.47% ILLRW (kg) 5.32x10⁻⁴ 1.14x10⁻⁴ 2.04x10⁻⁴ 4.06x10⁻⁴ 2.23x10⁻⁶ 9.78x10⁻⁶ 5.29x10⁻³ 4.53x10⁻⁵ 1.89x10⁻⁵ 8.0% 1.7% 3.1% 6.1% 0.03% 0.15% 80% 0.68% 0.29% CRU (kg) 0.00 0.00 0.00 0.00 0.00 0.00 0.00 0.00 0.00 MR (kg) 0.00 0.00 0.00 0.00 0.103 0.00 0.412 0.00 0.00 0.00% 0.00% 0.00% 0.00% 20% 0.00% 80% 0.00% 0.00% MER (kg) Neg. Neg. Neg. Neg. Neg. Neg. Neg. Neg. Neg. EE (MJ) Neg. Neg. Neg. Neg. Neg. Neg. Neg. Neg. Neg. INA = Indicator not assessed | Neg. = Negligible

Environmental Product Declaration Ecore International ………………………………………………………………………………………………..………………………………………………………………………………………………………………… 40 © 2020 SCSglobalServices.com Table 41. Life Cycle Impact Assessment (LCIA) results for the Ecore Everlast Basic/ECOnights - High color flooring products over a 75-yr time horizon. Results reported in MJ are calculated using lower heating values. All values are rounded to three significant digits. Impact Category A1 A2 A3 A4 A5 B2 B4 C2 C4 CML-IA GWP (kg CO2 eq) 10.4 1.37 1.34 4.04 0.178 0.595 90.3 0.343 4.91 9.2% 1.2% 1.2% 3.6% 0.16% 0.52% 80% 0.30% 4.3% ODP (kg CFC-11 eq) 5.67x10⁻² 5.36x10⁻³ 4.80x10⁻³ 2.59x10⁻² 1.20x10⁻⁴ 2.76x10⁻³ 0.383 1.60x10⁻³ 1.15x10⁻³ 12% 1.1% 1.00% 5.4% 0.03% 0.57% 80% 0.33% 0.24% AP (kg SO2 eq) 1.89x10⁻² 1.27x10⁻³ 2.20x10⁻³ 4.67x10⁻³ 8.50x10⁻⁴ 1.06x10⁻³ 0.206 3.46x10⁻⁴ 2.32x10⁻² 7.3% 0.49% 0.85% 1.8% 0.33% 0.41% 80% 0.13% 9.0% EP (kg (PO4)3- eq) 5.81x10⁻³ 1.86x10⁻⁴ 4.73x10⁻⁴ 7.97x10⁻⁴ 1.26x10⁻⁵ 1.84x10⁻⁴ 3.35x10⁻² 5.30x10⁻⁵ 1.05x10⁻³ 14% 0.44% 1.1% 1.9% 0.03% 0.44% 80% 0.13% 2.5% POCP (kg C2H4 eq) 2.13x10⁻⁶ 2.40x10⁻⁷ 9.19x10⁻⁸ 7.02x10⁻⁷ 4.08x10⁻⁹ 3.34x10⁻⁸ 1.30x10⁻⁵ 5.97x10⁻⁸ 2.46x10⁻⁸ 13% 1.5% 0.56% 4.3% 0.03% 0.20% 80% 0.37% 0.15% ADPE (kg Sb eq) 5.84x10⁻⁷ 1.40x10⁻⁹ 2.11x10⁻⁷ 3.85x10⁻⁹ 1.14x10⁻¹¹ 3.29x10⁻⁹ 3.20x10⁻⁶ 9.36x10⁻¹¹ 4.92x10⁻¹⁰ 15% 0.04% 5.3% 0.10% 0.00% 0.08% 80% 0.00% 0.01% ADPF (MJ eq) 228 20.2 25.5 58.8 0.331 12.9 1,360 4.69 2.62 13% 1.2% 1.5% 3.4% 0.02% 0.76% 79% 0.27% 0.15% TRACI 2.1 GWP (kg CO2 eq) 10.4 1.36 1.31 4.03 0.173 0.585 87.8 0.342 4.39 9.4% 1.2% 1.2% 3.7% 0.16% 0.53% 80% 0.31% 4.0% ODP (kg CFC-11 eq) 5.90x10⁻² 6.28x10⁻³ 5.15x10⁻³ 2.91x10⁻² 1.62x10⁻⁴ 2.86x10⁻³ 0.417 1.98x10⁻³ 2.65x10⁻³ 11% 1.2% 0.98% 5.5% 0.03% 0.55% 80% 0.38% 0.51% AP (kg SO2 eq) 3.66x10⁻² 1.60x10⁻³ 4.45x10⁻³ 4.88x10⁻³ 2.32x10⁻³ 2.09x10⁻³ 0.447 2.60x10⁻⁴ 6.17x10⁻² 6.5% 0.28% 0.79% 0.87% 0.41% 0.37% 80% 0.05% 11% EP (kg N eq) 0.781 0.150 7.75x10⁻² 0.624 4.14x10⁻³ 3.31x10⁻² 6.87 5.60x10⁻² 2.46x10⁻² 9.1% 1.7% 0.90% 7.2% 0.05% 0.38% 80% 0.65% 0.29% SFP (kg O3 eq) 2.59x10⁻⁶ 3.19x10⁻⁷ 1.10x10⁻⁷ 9.34x10⁻⁷ 5.42x10⁻⁹ 4.01x10⁻⁸ 1.63x10⁻⁵ 7.95x10⁻⁸ 3.26x10⁻⁸ 13% 1.6% 0.54% 4.6% 0.03% 0.20% 80% 0.39% 0.16% FFD (MJ eq) 27.2 2.71 3.19 7.93 4.63x10⁻² 1.60 168 0.664 0.308 13% 1.3% 1.5% 3.7% 0.02% 0.76% 79% 0.31% 0.15%

Environmental Product Declaration Ecore International ………………………………………………………………………………………………..………………………………………………………………………………………… 41 Table 42. Resource use and waste flows for the Ecore Everlast Basic/ECOnights - High color flooring products over a 75-yr time horizon. Results reported in MJ are calculated using lower heating values. All values are rounded to three significant digits. Parameter A1 A2 A3 A4 A5 B2 B4 C2 C4 Resources RPRE (MJ) 8.42 0.224 10.4 0.626 2.26x10⁻³ 1.25 79.0 1.73x10⁻² 0.115 8.4% 0.22% 10% 0.63% 0.00% 1.2% 79% 0.02% 0.12% RPRM (MJ) 0.00 0.00 0.00 0.00 0.00 0.00 0.00 0.00 0.00 0.00 0.00 0.00 0.00 0.00 0.00 0.00 0.00 0.00 NRPRE (MJ) INA INA INA INA INA INA INA INA INA NRPRM (MJ) INA INA INA INA INA INA INA INA INA SM (kg) 1.31 0.00 0.00 0.00 0.00 0.00 5.24 0.00 0.00 20% 0.00% 0.00% 0.00% 0.00% 0.00% 80% 0.00% 0.00% RSF/NRSF (MJ) 0.00 0.00 0.00 0.00 0.00 0.00 0.00 0.00 0.00 RE (MJ) 0.00 0.00 0.00 0.00 0.00 0.00 0.00 0.00 0.00 FW (m3) 0.682 1.45x10⁻² 0.103 4.04x10⁻² 2.19x10⁻⁴ 9.71x10⁻² 3.39 1.52x10⁻³ 6.44x10⁻³ 16% 0.34% 2.4% 0.93% 0.01% 2.2% 78% 0.04% 0.15% Wastes HWD (kg) 2.34x10⁻⁴ 5.39x10⁻⁵ 2.68x10⁻⁵ 1.47x10⁻⁴ 9.34x10⁻⁷ 7.27x10⁻⁶ 1.94x10⁻³ 1.28x10⁻⁵ 8.93x10⁻⁶ 9.6% 2.2% 1.1% 6.1% 0.04% 0.30% 80% 0.53% 0.37% NHWD (kg) 1.06 0.966 0.313 2.55 0.169 5.62x10⁻² 54.0 2.22x10⁻² 8.43 1.6% 1.4% 0.46% 3.8% 0.25% 0.08% 80% 0.03% 12% HLRW (kg) 8.31x10⁻⁴ 1.83x10⁻⁴ 1.05x10⁻⁴ 4.99x10⁻⁴ 3.16x10⁻⁶ 2.61x10⁻⁵ 6.78x10⁻³ 4.31x10⁻⁵ 3.08x10⁻⁵ 9.8% 2.2% 1.2% 5.9% 0.04% 0.31% 80% 0.51% 0.36% ILLRW (kg) 7.95x10⁻⁴ 1.33x10⁻⁴ 7.74x10⁻⁵ 3.91x10⁻⁴ 2.25x10⁻⁶ 9.78x10⁻⁶ 5.78x10⁻³ 3.33x10⁻⁵ 1.40x10⁻⁵ 11% 1.8% 1.1% 5.4% 0.03% 0.14% 80% 0.46% 0.19% CRU (kg) 0.00 0.00 0.00 0.00 0.00 0.00 0.00 0.00 0.00 MR (kg) 0.00 0.00 0.00 0.00 0.100 0.00 0.402 0.00 0.00 0.00% 0.00% 0.00% 0.00% 20% 0.00% 80% 0.00% 0.00% MER (kg) Neg. Neg. Neg. Neg. Neg. Neg. Neg. Neg. Neg. EE (MJ) Neg. Neg. Neg. Neg. Neg. Neg. Neg. Neg. Neg. INA = Indicator not assessed | Neg. = Negligible

Environmental Product Declaration Ecore International ………………………………………………………………………………………………..………………………………………………………………………………………………………………… 42 © 2020 SCSglobalServices.com Table 43. Life Cycle Impact Assessment (LCIA) results for the Ecore Everlast Basic/ECOnights - Low color flooring products over a 75-yr time horizon. Results reported in MJ are calculated using lower heating values. All values are rounded to three significant digits. Impact Category A1 A2 A3 A4 A5 B2 B4 C2 C4 CML-IA GWP (kg CO2 eq) 6.75 0.674 1.34 4.04 0.178 0.595 73.0 0.343 4.92 7.4% 0.73% 1.5% 4.4% 0.19% 0.65% 79% 0.37% 5.4% ODP (kg CFC-11 eq) 3.53x10⁻² 2.65x10⁻³ 4.80x10⁻³ 2.59x10⁻² 1.20x10⁻⁴ 2.76x10⁻³ 0.286 1.60x10⁻³ 1.15x10⁻³ 9.8% 0.73% 1.3% 7.2% 0.03% 0.77% 79% 0.44% 0.32% AP (kg SO2 eq) 1.59x10⁻² 6.29x10⁻⁴ 2.20x10⁻³ 4.67x10⁻³ 8.50x10⁻⁴ 1.06x10⁻³ 0.191 3.45x10⁻⁴ 2.31x10⁻² 6.6% 0.26% 0.92% 2.0% 0.36% 0.44% 80% 0.14% 9.6% EP (kg (PO4)3- eq) 4.54x10⁻³ 9.17x10⁻⁵ 4.73x10⁻⁴ 7.97x10⁻⁴ 1.26x10⁻⁵ 1.84x10⁻⁴ 2.81x10⁻² 5.30x10⁻⁵ 1.05x10⁻³ 13% 0.26% 1.3% 2.3% 0.04% 0.52% 80% 0.15% 3.0% POCP (kg C2H4 eq) 1.09x10⁻⁶ 1.18x10⁻⁷ 9.19x10⁻⁸ 7.02x10⁻⁷ 4.08x10⁻⁹ 3.34x10⁻⁸ 8.36x10⁻⁶ 5.97x10⁻⁸ 2.46x10⁻⁸ 10% 1.1% 0.88% 6.7% 0.04% 0.32% 80% 0.57% 0.23% ADPE (kg Sb eq) 4.02x10⁻⁷ 6.92x10⁻¹⁰ 2.11x10⁻⁷ 3.85x10⁻⁹ 1.14x10⁻¹¹ 3.29x10⁻⁹ 2.47x10⁻⁶ 9.36x10⁻¹¹ 4.93x10⁻¹⁰ 13% 0.02% 6.8% 0.12% 0.00% 0.11% 80% 0.00% 0.02% ADPF (MJ eq) 104 9.96 25.5 58.8 0.331 12.9 822 4.69 2.63 10.0% 0.96% 2.4% 5.7% 0.03% 1.2% 79% 0.45% 0.25% TRACI 2.1 GWP (kg CO2 eq) 6.76 0.672 1.31 4.03 0.173 0.585 70.7 0.342 4.40 7.6% 0.76% 1.5% 4.5% 0.19% 0.66% 79% 0.38% 4.9% ODP (kg CFC-11 eq) 3.61x10⁻² 3.10x10⁻³ 5.15x10⁻³ 2.91x10⁻² 1.62x10⁻⁴ 2.86x10⁻³ 0.313 1.98x10⁻³ 2.66x10⁻³ 9.2% 0.79% 1.3% 7.4% 0.04% 0.73% 79% 0.50% 0.67% AP (kg SO2 eq) 3.15x10⁻² 7.87x10⁻⁴ 4.45x10⁻³ 4.88x10⁻³ 2.32x10⁻³ 2.09x10⁻³ 0.423 2.60x10⁻⁴ 6.15x10⁻² 5.9% 0.15% 0.84% 0.92% 0.44% 0.39% 80% 0.05% 12% EP (kg N eq) 0.504 7.38x10⁻² 7.75x10⁻² 0.624 4.14x10⁻³ 3.31x10⁻² 5.46 5.60x10⁻² 2.46x10⁻² 7.4% 1.1% 1.1% 9.1% 0.06% 0.48% 80% 0.82% 0.36% SFP (kg O3 eq) 1.23x10⁻⁶ 1.57x10⁻⁷ 1.10x10⁻⁷ 9.34x10⁻⁷ 5.42x10⁻⁹ 4.01x10⁻⁸ 1.02x10⁻⁵ 7.95x10⁻⁸ 3.26x10⁻⁸ 9.6% 1.2% 0.86% 7.3% 0.04% 0.31% 80% 0.62% 0.26% FFD (MJ eq) 10.4 1.34 3.19 7.93 4.63x10⁻² 1.60 95.6 0.664 0.308 8.6% 1.1% 2.6% 6.5% 0.04% 1.3% 79% 0.55% 0.25%
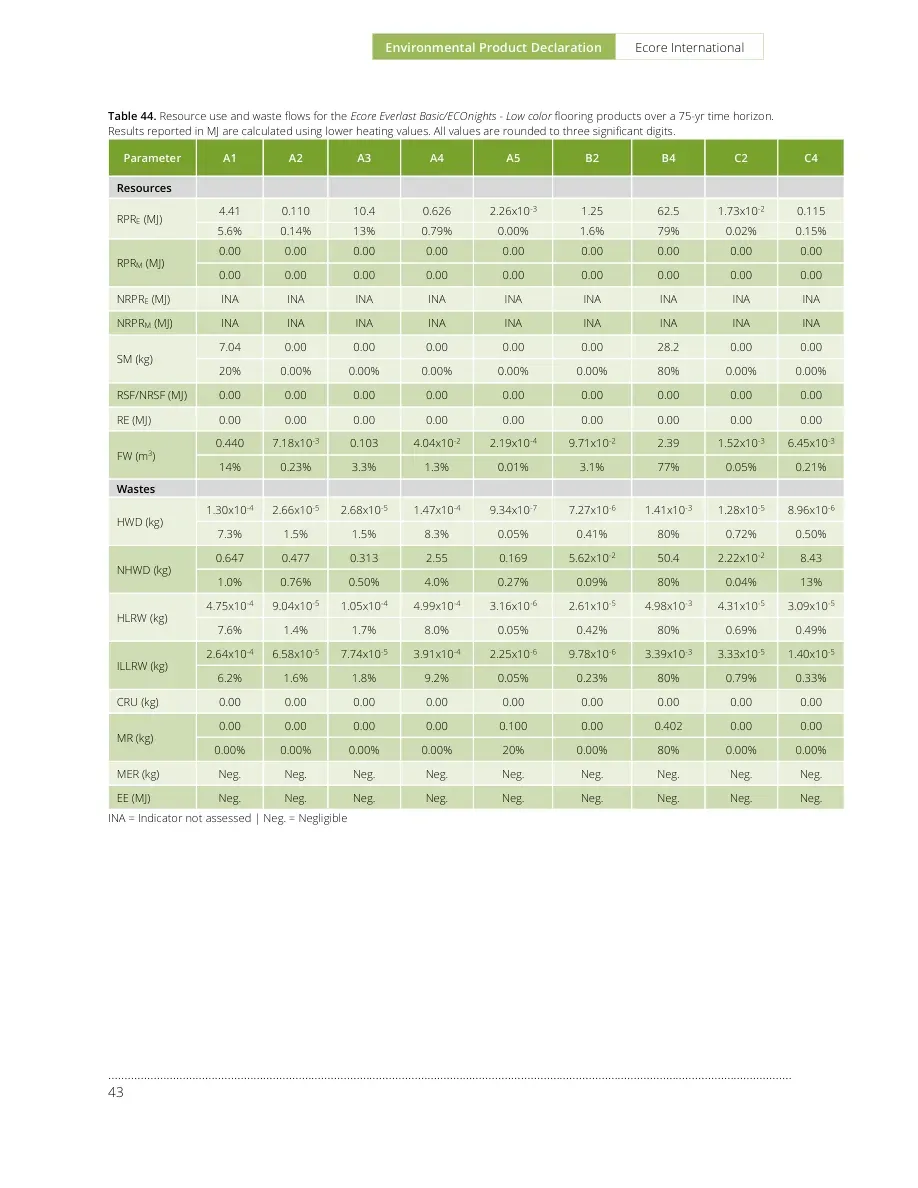
Environmental Product Declaration Ecore International ………………………………………………………………………………………………..………………………………………………………………………………………… 43 Table 44. Resource use and waste flows for the Ecore Everlast Basic/ECOnights - Low color flooring products over a 75-yr time horizon. Results reported in MJ are calculated using lower heating values. All values are rounded to three significant digits. Parameter A1 A2 A3 A4 A5 B2 B4 C2 C4 Resources RPRE (MJ) 4.41 0.110 10.4 0.626 2.26x10⁻³ 1.25 62.5 1.73x10⁻² 0.115 5.6% 0.14% 13% 0.79% 0.00% 1.6% 79% 0.02% 0.15% RPRM (MJ) 0.00 0.00 0.00 0.00 0.00 0.00 0.00 0.00 0.00 0.00 0.00 0.00 0.00 0.00 0.00 0.00 0.00 0.00 NRPRE (MJ) INA INA INA INA INA INA INA INA INA NRPRM (MJ) INA INA INA INA INA INA INA INA INA SM (kg) 7.04 0.00 0.00 0.00 0.00 0.00 28.2 0.00 0.00 20% 0.00% 0.00% 0.00% 0.00% 0.00% 80% 0.00% 0.00% RSF/NRSF (MJ) 0.00 0.00 0.00 0.00 0.00 0.00 0.00 0.00 0.00 RE (MJ) 0.00 0.00 0.00 0.00 0.00 0.00 0.00 0.00 0.00 FW (m3) 0.440 7.18x10⁻³ 0.103 4.04x10⁻² 2.19x10⁻⁴ 9.71x10⁻² 2.39 1.52x10⁻³ 6.45x10⁻³ 14% 0.23% 3.3% 1.3% 0.01% 3.1% 77% 0.05% 0.21% Wastes HWD (kg) 1.30x10⁻⁴ 2.66x10⁻⁵ 2.68x10⁻⁵ 1.47x10⁻⁴ 9.34x10⁻⁷ 7.27x10⁻⁶ 1.41x10⁻³ 1.28x10⁻⁵ 8.96x10⁻⁶ 7.3% 1.5% 1.5% 8.3% 0.05% 0.41% 80% 0.72% 0.50% NHWD (kg) 0.647 0.477 0.313 2.55 0.169 5.62x10⁻² 50.4 2.22x10⁻² 8.43 1.0% 0.76% 0.50% 4.0% 0.27% 0.09% 80% 0.04% 13% HLRW (kg) 4.75x10⁻⁴ 9.04x10⁻⁵ 1.05x10⁻⁴ 4.99x10⁻⁴ 3.16x10⁻⁶ 2.61x10⁻⁵ 4.98x10⁻³ 4.31x10⁻⁵ 3.09x10⁻⁵ 7.6% 1.4% 1.7% 8.0% 0.05% 0.42% 80% 0.69% 0.49% ILLRW (kg) 2.64x10⁻⁴ 6.58x10⁻⁵ 7.74x10⁻⁵ 3.91x10⁻⁴ 2.25x10⁻⁶ 9.78x10⁻⁶ 3.39x10⁻³ 3.33x10⁻⁵ 1.40x10⁻⁵ 6.2% 1.6% 1.8% 9.2% 0.05% 0.23% 80% 0.79% 0.33% CRU (kg) 0.00 0.00 0.00 0.00 0.00 0.00 0.00 0.00 0.00 MR (kg) 0.00 0.00 0.00 0.00 0.100 0.00 0.402 0.00 0.00 0.00% 0.00% 0.00% 0.00% 20% 0.00% 80% 0.00% 0.00% MER (kg) Neg. Neg. Neg. Neg. Neg. Neg. Neg. Neg. Neg. EE (MJ) Neg. Neg. Neg. Neg. Neg. Neg. Neg. Neg. Neg. INA = Indicator not assessed | Neg. = Negligible
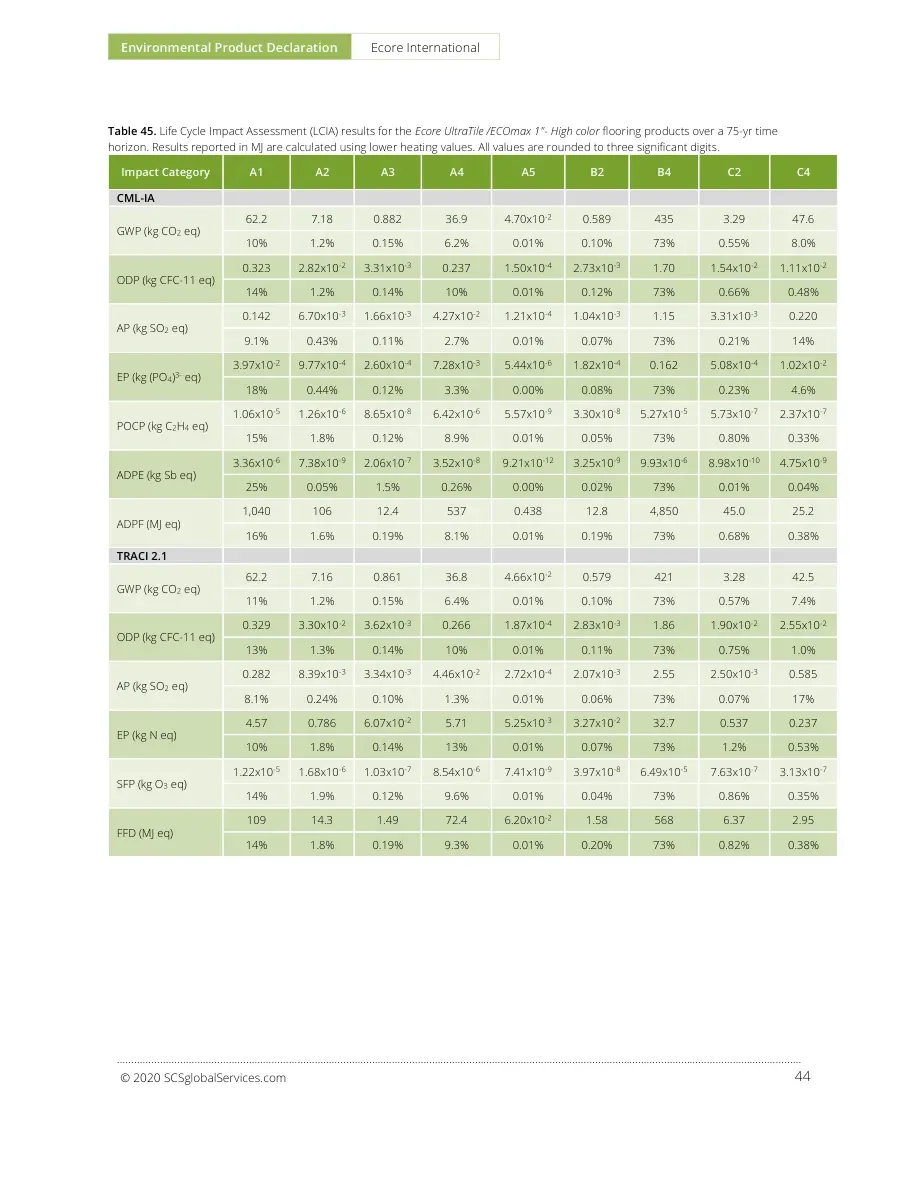
Environmental Product Declaration Ecore International ………………………………………………………………………………………………..………………………………………………………………………………………………………………… 44 © 2020 SCSglobalServices.com Table 45. Life Cycle Impact Assessment (LCIA) results for the Ecore UltraTile /ECOmax 1"- High color flooring products over a 75-yr time horizon. Results reported in MJ are calculated using lower heating values. All values are rounded to three significant digits. Impact Category A1 A2 A3 A4 A5 B2 B4 C2 C4 CML-IA GWP (kg CO2 eq) 62.2 7.18 0.882 36.9 4.70x10⁻² 0.589 435 3.29 47.6 10% 1.2% 0.15% 6.2% 0.01% 0.10% 73% 0.55% 8.0% ODP (kg CFC-11 eq) 0.323 2.82x10⁻² 3.31x10⁻³ 0.237 1.50x10⁻⁴ 2.73x10⁻³ 1.70 1.54x10⁻² 1.11x10⁻² 14% 1.2% 0.14% 10% 0.01% 0.12% 73% 0.66% 0.48% AP (kg SO2 eq) 0.142 6.70x10⁻³ 1.66x10⁻³ 4.27x10⁻² 1.21x10⁻⁴ 1.04x10⁻³ 1.15 3.31x10⁻³ 0.220 9.1% 0.43% 0.11% 2.7% 0.01% 0.07% 73% 0.21% 14% EP (kg (PO4)3- eq) 3.97x10⁻² 9.77x10⁻⁴ 2.60x10⁻⁴ 7.28x10⁻³ 5.44x10⁻⁶ 1.82x10⁻⁴ 0.162 5.08x10⁻⁴ 1.02x10⁻² 18% 0.44% 0.12% 3.3% 0.00% 0.08% 73% 0.23% 4.6% POCP (kg C2H4 eq) 1.06x10⁻⁵ 1.26x10⁻⁶ 8.65x10⁻⁸ 6.42x10⁻⁶ 5.57x10⁻⁹ 3.30x10⁻⁸ 5.27x10⁻⁵ 5.73x10⁻⁷ 2.37x10⁻⁷ 15% 1.8% 0.12% 8.9% 0.01% 0.05% 73% 0.80% 0.33% ADPE (kg Sb eq) 3.36x10⁻⁶ 7.38x10⁻⁹ 2.06x10⁻⁷ 3.52x10⁻⁸ 9.21x10⁻¹² 3.25x10⁻⁹ 9.93x10⁻⁶ 8.98x10⁻¹⁰ 4.75x10⁻⁹ 25% 0.05% 1.5% 0.26% 0.00% 0.02% 73% 0.01% 0.04% ADPF (MJ eq) 1,040 106 12.4 537 0.438 12.8 4,850 45.0 25.2 16% 1.6% 0.19% 8.1% 0.01% 0.19% 73% 0.68% 0.38% TRACI 2.1 GWP (kg CO2 eq) 62.2 7.16 0.861 36.8 4.66x10⁻² 0.579 421 3.28 42.5 11% 1.2% 0.15% 6.4% 0.01% 0.10% 73% 0.57% 7.4% ODP (kg CFC-11 eq) 0.329 3.30x10⁻² 3.62x10⁻³ 0.266 1.87x10⁻⁴ 2.83x10⁻³ 1.86 1.90x10⁻² 2.55x10⁻² 13% 1.3% 0.14% 10% 0.01% 0.11% 73% 0.75% 1.0% AP (kg SO2 eq) 0.282 8.39x10⁻³ 3.34x10⁻³ 4.46x10⁻² 2.72x10⁻⁴ 2.07x10⁻³ 2.55 2.50x10⁻³ 0.585 8.1% 0.24% 0.10% 1.3% 0.01% 0.06% 73% 0.07% 17% EP (kg N eq) 4.57 0.786 6.07x10⁻² 5.71 5.25x10⁻³ 3.27x10⁻² 32.7 0.537 0.237 10% 1.8% 0.14% 13% 0.01% 0.07% 73% 1.2% 0.53% SFP (kg O3 eq) 1.22x10⁻⁵ 1.68x10⁻⁶ 1.03x10⁻⁷ 8.54x10⁻⁶ 7.41x10⁻⁹ 3.97x10⁻⁸ 6.49x10⁻⁵ 7.63x10⁻⁷ 3.13x10⁻⁷ 14% 1.9% 0.12% 9.6% 0.01% 0.04% 73% 0.86% 0.35% FFD (MJ eq) 109 14.3 1.49 72.4 6.20x10⁻² 1.58 568 6.37 2.95 14% 1.8% 0.19% 9.3% 0.01% 0.20% 73% 0.82% 0.38%
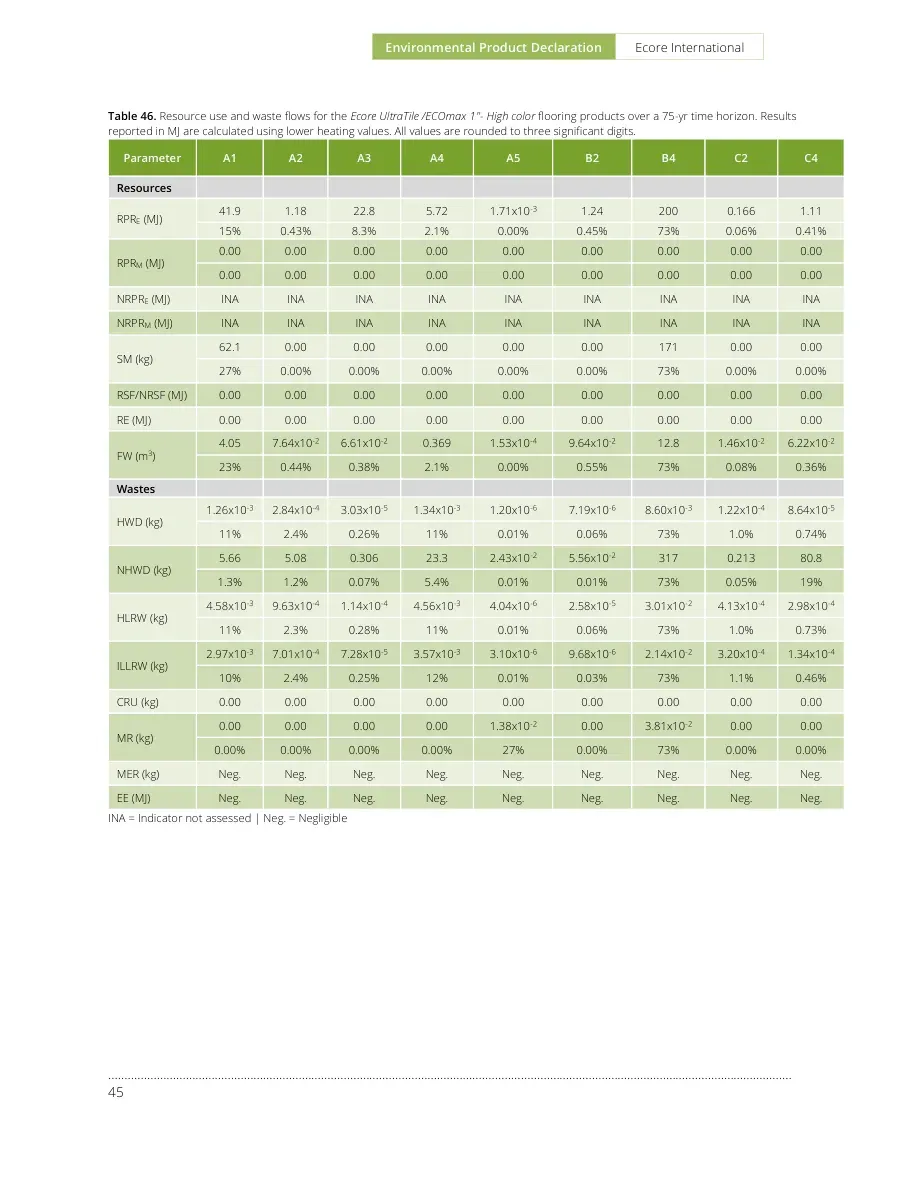
Environmental Product Declaration Ecore International ………………………………………………………………………………………………..………………………………………………………………………………………… 45 Table 46. Resource use and waste flows for the Ecore UltraTile /ECOmax 1"- High color flooring products over a 75-yr time horizon. Results reported in MJ are calculated using lower heating values. All values are rounded to three significant digits. Parameter A1 A2 A3 A4 A5 B2 B4 C2 C4 Resources RPRE (MJ) 41.9 1.18 22.8 5.72 1.71x10⁻³ 1.24 200 0.166 1.11 15% 0.43% 8.3% 2.1% 0.00% 0.45% 73% 0.06% 0.41% RPRM (MJ) 0.00 0.00 0.00 0.00 0.00 0.00 0.00 0.00 0.00 0.00 0.00 0.00 0.00 0.00 0.00 0.00 0.00 0.00 NRPRE (MJ) INA INA INA INA INA INA INA INA INA NRPRM (MJ) INA INA INA INA INA INA INA INA INA SM (kg) 62.1 0.00 0.00 0.00 0.00 0.00 171 0.00 0.00 27% 0.00% 0.00% 0.00% 0.00% 0.00% 73% 0.00% 0.00% RSF/NRSF (MJ) 0.00 0.00 0.00 0.00 0.00 0.00 0.00 0.00 0.00 RE (MJ) 0.00 0.00 0.00 0.00 0.00 0.00 0.00 0.00 0.00 FW (m3) 4.05 7.64x10⁻² 6.61x10⁻² 0.369 1.53x10⁻⁴ 9.64x10⁻² 12.8 1.46x10⁻² 6.22x10⁻² 23% 0.44% 0.38% 2.1% 0.00% 0.55% 73% 0.08% 0.36% Wastes HWD (kg) 1.26x10⁻³ 2.84x10⁻⁴ 3.03x10⁻⁵ 1.34x10⁻³ 1.20x10⁻⁶ 7.19x10⁻⁶ 8.60x10⁻³ 1.22x10⁻⁴ 8.64x10⁻⁵ 11% 2.4% 0.26% 11% 0.01% 0.06% 73% 1.0% 0.74% NHWD (kg) 5.66 5.08 0.306 23.3 2.43x10⁻² 5.56x10⁻² 317 0.213 80.8 1.3% 1.2% 0.07% 5.4% 0.01% 0.01% 73% 0.05% 19% HLRW (kg) 4.58x10⁻³ 9.63x10⁻⁴ 1.14x10⁻⁴ 4.56x10⁻³ 4.04x10⁻⁶ 2.58x10⁻⁵ 3.01x10⁻² 4.13x10⁻⁴ 2.98x10⁻⁴ 11% 2.3% 0.28% 11% 0.01% 0.06% 73% 1.0% 0.73% ILLRW (kg) 2.97x10⁻³ 7.01x10⁻⁴ 7.28x10⁻⁵ 3.57x10⁻³ 3.10x10⁻⁶ 9.68x10⁻⁶ 2.14x10⁻² 3.20x10⁻⁴ 1.34x10⁻⁴ 10% 2.4% 0.25% 12% 0.01% 0.03% 73% 1.1% 0.46% CRU (kg) 0.00 0.00 0.00 0.00 0.00 0.00 0.00 0.00 0.00 MR (kg) 0.00 0.00 0.00 0.00 1.38x10⁻² 0.00 3.81x10⁻² 0.00 0.00 0.00% 0.00% 0.00% 0.00% 27% 0.00% 73% 0.00% 0.00% MER (kg) Neg. Neg. Neg. Neg. Neg. Neg. Neg. Neg. Neg. EE (MJ) Neg. Neg. Neg. Neg. Neg. Neg. Neg. Neg. Neg. INA = Indicator not assessed | Neg. = Negligible
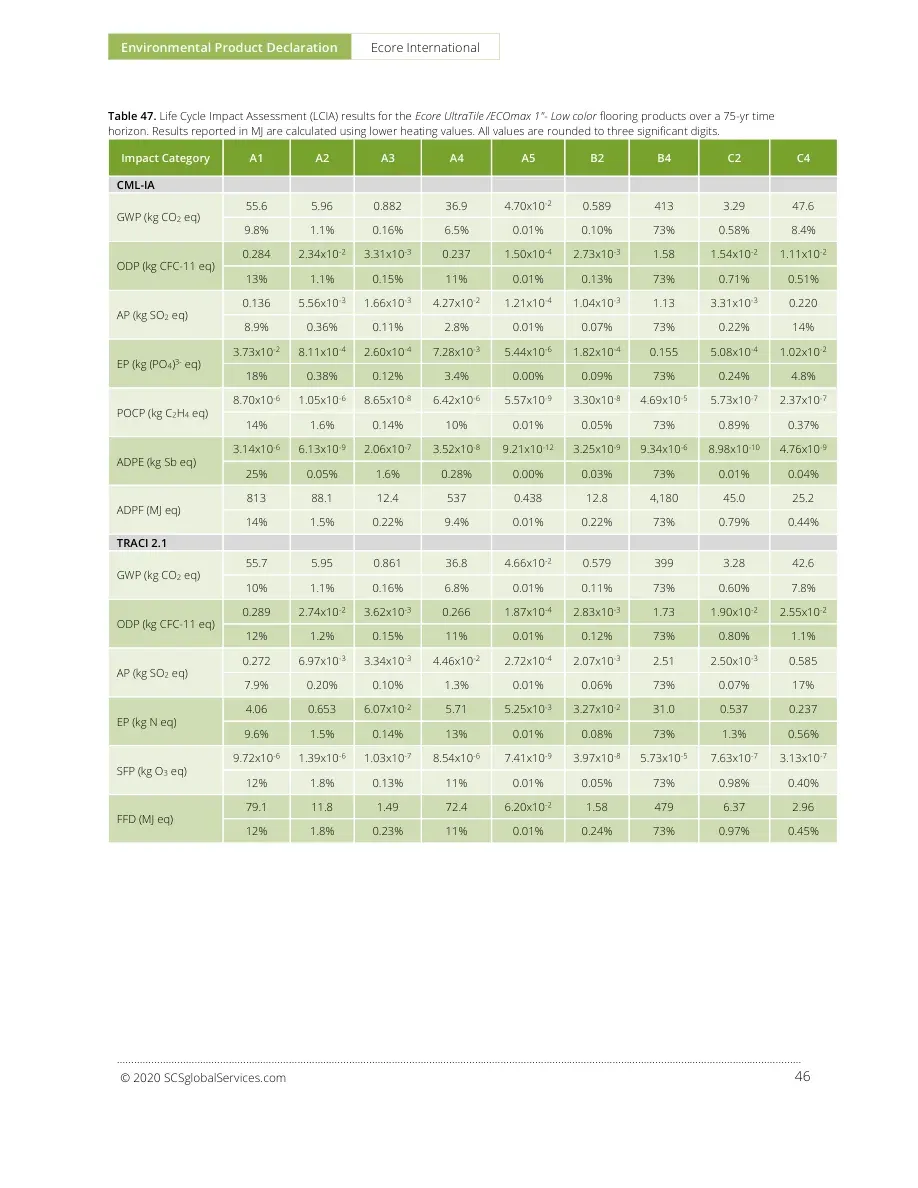
Environmental Product Declaration Ecore International ………………………………………………………………………………………………..………………………………………………………………………………………………………………… 46 © 2020 SCSglobalServices.com Table 47. Life Cycle Impact Assessment (LCIA) results for the Ecore UltraTile /ECOmax 1"- Low color flooring products over a 75-yr time horizon. Results reported in MJ are calculated using lower heating values. All values are rounded to three significant digits. Impact Category A1 A2 A3 A4 A5 B2 B4 C2 C4 CML-IA GWP (kg CO2 eq) 55.6 5.96 0.882 36.9 4.70x10⁻² 0.589 413 3.29 47.6 9.8% 1.1% 0.16% 6.5% 0.01% 0.10% 73% 0.58% 8.4% ODP (kg CFC-11 eq) 0.284 2.34x10⁻² 3.31x10⁻³ 0.237 1.50x10⁻⁴ 2.73x10⁻³ 1.58 1.54x10⁻² 1.11x10⁻² 13% 1.1% 0.15% 11% 0.01% 0.13% 73% 0.71% 0.51% AP (kg SO2 eq) 0.136 5.56x10⁻³ 1.66x10⁻³ 4.27x10⁻² 1.21x10⁻⁴ 1.04x10⁻³ 1.13 3.31x10⁻³ 0.220 8.9% 0.36% 0.11% 2.8% 0.01% 0.07% 73% 0.22% 14% EP (kg (PO4)3- eq) 3.73x10⁻² 8.11x10⁻⁴ 2.60x10⁻⁴ 7.28x10⁻³ 5.44x10⁻⁶ 1.82x10⁻⁴ 0.155 5.08x10⁻⁴ 1.02x10⁻² 18% 0.38% 0.12% 3.4% 0.00% 0.09% 73% 0.24% 4.8% POCP (kg C2H4 eq) 8.70x10⁻⁶ 1.05x10⁻⁶ 8.65x10⁻⁸ 6.42x10⁻⁶ 5.57x10⁻⁹ 3.30x10⁻⁸ 4.69x10⁻⁵ 5.73x10⁻⁷ 2.37x10⁻⁷ 14% 1.6% 0.14% 10% 0.01% 0.05% 73% 0.89% 0.37% ADPE (kg Sb eq) 3.14x10⁻⁶ 6.13x10⁻⁹ 2.06x10⁻⁷ 3.52x10⁻⁸ 9.21x10⁻¹² 3.25x10⁻⁹ 9.34x10⁻⁶ 8.98x10⁻¹⁰ 4.76x10⁻⁹ 25% 0.05% 1.6% 0.28% 0.00% 0.03% 73% 0.01% 0.04% ADPF (MJ eq) 813 88.1 12.4 537 0.438 12.8 4,180 45.0 25.2 14% 1.5% 0.22% 9.4% 0.01% 0.22% 73% 0.79% 0.44% TRACI 2.1 GWP (kg CO2 eq) 55.7 5.95 0.861 36.8 4.66x10⁻² 0.579 399 3.28 42.6 10% 1.1% 0.16% 6.8% 0.01% 0.11% 73% 0.60% 7.8% ODP (kg CFC-11 eq) 0.289 2.74x10⁻² 3.62x10⁻³ 0.266 1.87x10⁻⁴ 2.83x10⁻³ 1.73 1.90x10⁻² 2.55x10⁻² 12% 1.2% 0.15% 11% 0.01% 0.12% 73% 0.80% 1.1% AP (kg SO2 eq) 0.272 6.97x10⁻³ 3.34x10⁻³ 4.46x10⁻² 2.72x10⁻⁴ 2.07x10⁻³ 2.51 2.50x10⁻³ 0.585 7.9% 0.20% 0.10% 1.3% 0.01% 0.06% 73% 0.07% 17% EP (kg N eq) 4.06 0.653 6.07x10⁻² 5.71 5.25x10⁻³ 3.27x10⁻² 31.0 0.537 0.237 9.6% 1.5% 0.14% 13% 0.01% 0.08% 73% 1.3% 0.56% SFP (kg O3 eq) 9.72x10⁻⁶ 1.39x10⁻⁶ 1.03x10⁻⁷ 8.54x10⁻⁶ 7.41x10⁻⁹ 3.97x10⁻⁸ 5.73x10⁻⁵ 7.63x10⁻⁷ 3.13x10⁻⁷ 12% 1.8% 0.13% 11% 0.01% 0.05% 73% 0.98% 0.40% FFD (MJ eq) 79.1 11.8 1.49 72.4 6.20x10⁻² 1.58 479 6.37 2.96 12% 1.8% 0.23% 11% 0.01% 0.24% 73% 0.97% 0.45%
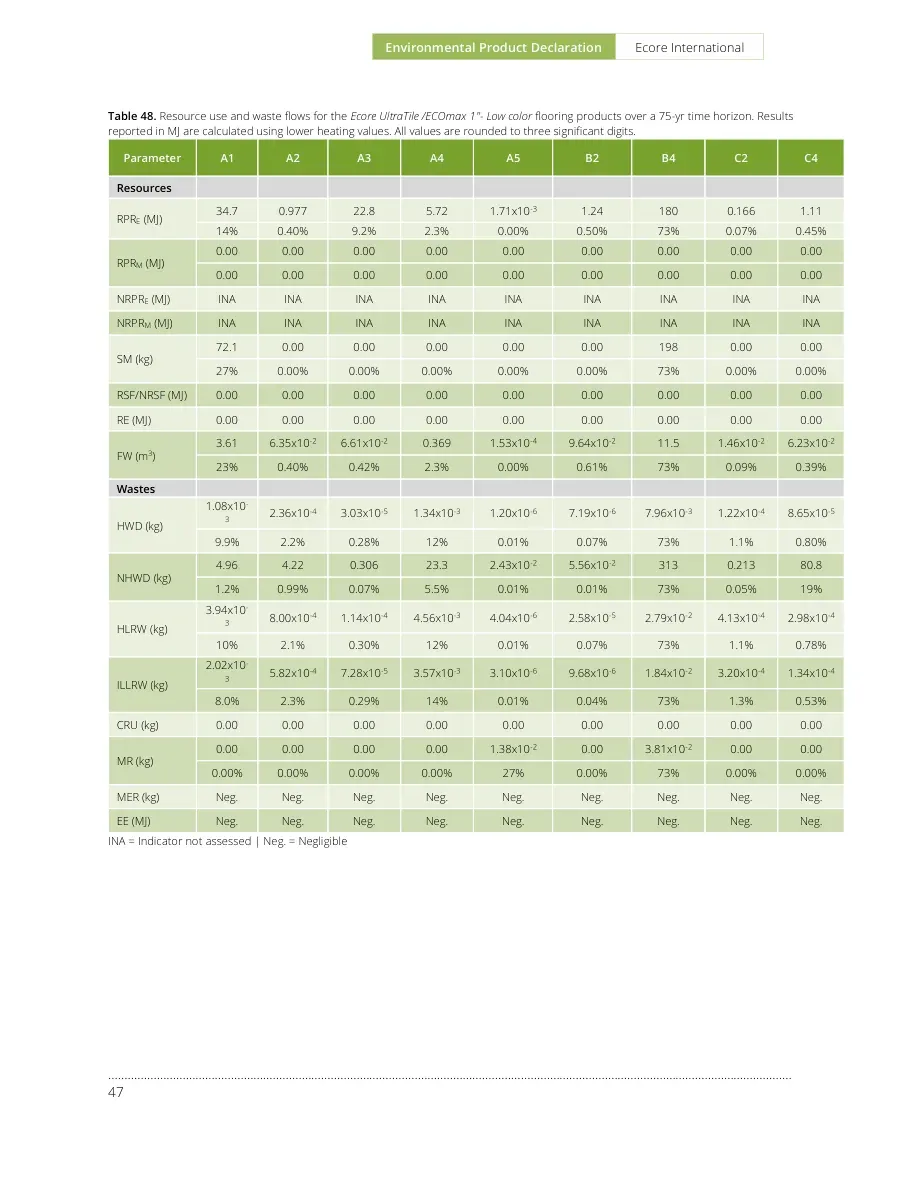
Environmental Product Declaration Ecore International ………………………………………………………………………………………………..………………………………………………………………………………………… 47 Table 48. Resource use and waste flows for the Ecore UltraTile /ECOmax 1"- Low color flooring products over a 75-yr time horizon. Results reported in MJ are calculated using lower heating values. All values are rounded to three significant digits. Parameter A1 A2 A3 A4 A5 B2 B4 C2 C4 Resources RPRE (MJ) 34.7 0.977 22.8 5.72 1.71x10⁻³ 1.24 180 0.166 1.11 14% 0.40% 9.2% 2.3% 0.00% 0.50% 73% 0.07% 0.45% RPRM (MJ) 0.00 0.00 0.00 0.00 0.00 0.00 0.00 0.00 0.00 0.00 0.00 0.00 0.00 0.00 0.00 0.00 0.00 0.00 NRPRE (MJ) INA INA INA INA INA INA INA INA INA NRPRM (MJ) INA INA INA INA INA INA INA INA INA SM (kg) 72.1 0.00 0.00 0.00 0.00 0.00 198 0.00 0.00 27% 0.00% 0.00% 0.00% 0.00% 0.00% 73% 0.00% 0.00% RSF/NRSF (MJ) 0.00 0.00 0.00 0.00 0.00 0.00 0.00 0.00 0.00 RE (MJ) 0.00 0.00 0.00 0.00 0.00 0.00 0.00 0.00 0.00 FW (m3) 3.61 6.35x10⁻² 6.61x10⁻² 0.369 1.53x10⁻⁴ 9.64x10⁻² 11.5 1.46x10⁻² 6.23x10⁻² 23% 0.40% 0.42% 2.3% 0.00% 0.61% 73% 0.09% 0.39% Wastes HWD (kg) 1.08x10⁻³ 2.36x10⁻⁴ 3.03x10⁻⁵ 1.34x10⁻³ 1.20x10⁻⁶ 7.19x10⁻⁶ 7.96x10⁻³ 1.22x10⁻⁴ 8.65x10⁻⁵ 9.9% 2.2% 0.28% 12% 0.01% 0.07% 73% 1.1% 0.80% NHWD (kg) 4.96 4.22 0.306 23.3 2.43x10⁻² 5.56x10⁻² 313 0.213 80.8 1.2% 0.99% 0.07% 5.5% 0.01% 0.01% 73% 0.05% 19% HLRW (kg) 3.94x10⁻³ 8.00x10⁻⁴ 1.14x10⁻⁴ 4.56x10⁻³ 4.04x10⁻⁶ 2.58x10⁻⁵ 2.79x10⁻² 4.13x10⁻⁴ 2.98x10⁻⁴ 10% 2.1% 0.30% 12% 0.01% 0.07% 73% 1.1% 0.78% ILLRW (kg) 2.02x10⁻³ 5.82x10⁻⁴ 7.28x10⁻⁵ 3.57x10⁻³ 3.10x10⁻⁶ 9.68x10⁻⁶ 1.84x10⁻² 3.20x10⁻⁴ 1.34x10⁻⁴ 8.0% 2.3% 0.29% 14% 0.01% 0.04% 73% 1.3% 0.53% CRU (kg) 0.00 0.00 0.00 0.00 0.00 0.00 0.00 0.00 0.00 MR (kg) 0.00 0.00 0.00 0.00 1.38x10⁻² 0.00 3.81x10⁻² 0.00 0.00 0.00% 0.00% 0.00% 0.00% 27% 0.00% 73% 0.00% 0.00% MER (kg) Neg. Neg. Neg. Neg. Neg. Neg. Neg. Neg. Neg. EE (MJ) Neg. Neg. Neg. Neg. Neg. Neg. Neg. Neg. Neg. INA = Indicator not assessed | Neg. = Negligible

Environmental Product Declaration Ecore International ………………………………………………………………………………………………..………………………………………………………………………………………………………………… 48 © 2020 SCSglobalServices.com Table 49. Life Cycle Impact Assessment (LCIA) results for the Ecore QT/ECOsilence - SCU flooring products over a 75-yr time horizon. Results reported in MJ are calculated using lower heating values. All values are rounded to three significant digits. Impact Category A1 A2 A3 A4 A5 B2 B4 C2 C4 CML-IA GWP (kg CO2 eq) 3.86 0.287 1.70 1.65 3.42x10⁻² 0.00 0.00 0.160 2.22 39% 2.9% 17% 17% 0.35% 0.00% 0.00% 1.6% 22% ODP (kg CFC-11 eq) 2.00x10⁻² 1.13x10⁻³ 6.40x10⁻³ 1.17x10⁻² 1.43x10⁻⁴ 0.00 0.00 7.46x10⁻⁴ 5.27x10⁻⁴ 49% 2.8% 16% 29% 0.35% 0.00% 0.00% 1.8% 1.3% AP (kg SO2 eq) 9.13x10⁻³ 2.67x10⁻⁴ 3.42x10⁻³ 2.01x10⁻³ 4.06x10⁻⁵ 0.00 0.00 1.61x10⁻⁴ 1.10x10⁻² 35% 1.0% 13% 7.7% 0.16% 0.00% 0.00% 0.62% 42% EP (kg (PO4)3- eq) 2.78x10⁻³ 3.90x10⁻⁵ 3.88x10⁻⁴ 3.53x10⁻⁴ 5.39x10⁻⁶ 0.00 0.00 2.47x10⁻⁵ 4.74x10⁻⁴ 68% 0.96% 9.6% 8.7% 0.13% 0.00% 0.00% 0.61% 12% POCP (kg C2H4 eq) 6.29x10⁻⁷ 5.03x10⁻⁸ 1.89x10⁻⁷ 2.85x10⁻⁷ 5.30x10⁻⁹ 0.00 0.00 2.78x10⁻⁸ 1.14x10⁻⁸ 53% 4.2% 16% 24% 0.44% 0.00% 0.00% 2.3% 0.95% ADPE (kg Sb eq) 1.37x10⁻⁷ 2.94x10⁻¹⁰ 6.71x10⁻⁷ 1.53x10⁻⁹ 8.49x10⁻¹² 0.00 0.00 4.36x10⁻¹¹ 2.25x10⁻¹⁰ 17% 0.04% 83% 0.19% 0.00% 0.00% 0.00% 0.01% 0.03% ADPF (MJ eq) 56.8 4.23 21.1 23.8 0.416 0.00 0.00 2.18 1.21 52% 3.9% 19% 22% 0.38% 0.00% 0.00% 2.0% 1.1% TRACI 2.1 GWP (kg CO2 eq) 3.87 0.286 1.66 1.64 3.39x10⁻² 0.00 0.00 0.159 1.99 40% 3.0% 17% 17% 0.35% 0.00% 0.00% 1.7% 21% ODP (kg CFC-11 eq) 2.02x10⁻² 1.32x10⁻³ 6.97x10⁻³ 1.30x10⁻² 1.77x10⁻⁴ 0.00 0.00 9.22x10⁻⁴ 1.23x10⁻³ 46% 3.0% 16% 30% 0.40% 0.00% 0.00% 2.1% 2.8% AP (kg SO2 eq) 1.79x10⁻² 3.35x10⁻⁴ 6.91x10⁻³ 2.01x10⁻³ 5.01x10⁻⁵ 0.00 0.00 1.21x10⁻⁴ 2.94x10⁻² 32% 0.59% 12% 3.5% 0.09% 0.00% 0.00% 0.21% 52% EP (kg N eq) 0.296 3.14x10⁻² 0.110 0.275 4.97x10⁻³ 0.00 0.00 2.61x10⁻² 1.13x10⁻² 39% 4.2% 15% 36% 0.66% 0.00% 0.00% 3.5% 1.5% SFP (kg O3 eq) 6.96x10⁻⁷ 6.69x10⁻⁸ 2.18x10⁻⁷ 3.79x10⁻⁷ 7.06x10⁻⁹ 0.00 0.00 3.70x10⁻⁸ 1.51x10⁻⁸ 49% 4.7% 15% 27% 0.50% 0.00% 0.00% 2.6% 1.1% FFD (MJ eq) 5.59 0.569 2.50 3.22 5.89x10⁻² 0.00 0.00 0.309 0.143 45% 4.6% 20% 26% 0.48% 0.00% 0.00% 2.5% 1.2%

Environmental Product Declaration Ecore International ………………………………………………………………………………………………..………………………………………………………………………………………… 49 Table 50. Resource use and waste flows for the Ecore QT/ECOsilence - SCU flooring products over a 75-yr time horizon. Results reported in MJ are calculated using lower heating values. All values are rounded to three significant digits. Parameter A1 A2 A3 A4 A5 B2 B4 C2 C4 Resources RPRE (MJ) 2.49 4.70x10⁻² 32.5 0.251 1.58x10⁻³ 0.00 0.00 8.04x10⁻³ 5.25x10⁻² 7.0% 0.13% 92% 0.71% 0.00% 0.00% 0.00% 0.02% 0.15% RPRM (MJ) 0.00 0.00 0.00 0.00 0.00 0.00 0.00 0.00 0.00 0.00 0.00 0.00 0.00 0.00 0.00 0.00 0.00 0.00 NRPRE (MJ) INA INA INA INA INA INA INA INA INA NRPRM (MJ) INA INA INA INA INA INA INA INA INA SM (kg) 3.41 0.00 0.00 0.00 0.00 0.00 0.00 0.00 0.00 100% 0.00% 0.00% 0.00% 0.00% 0.00% 0.00% 0.00% 0.00% RSF/NRSF (MJ) 0.00 0.00 0.00 0.00 0.00 0.00 0.00 0.00 0.00 RE (MJ) 0.00 0.00 0.00 0.00 0.00 0.00 0.00 0.00 0.00 FW (m3) 0.250 3.05x10⁻³ 0.156 1.61x10⁻² 1.38x10⁻⁴ 0.00 0.00 7.07x10⁻⁴ 2.94x10⁻³ 58% 0.71% 36% 3.8% 0.03% 0.00% 0.00% 0.16% 0.69% Wastes HWD (kg) 7.03x10⁻⁵ 1.13x10⁻⁵ 6.41x10⁻⁵ 5.84x10⁻⁵ 1.13x10⁻⁶ 0.00 0.00 5.94x10⁻⁶ 4.07x10⁻⁶ 33% 5.3% 30% 27% 0.53% 0.00% 0.00% 2.8% 1.9% NHWD (kg) 0.347 0.203 0.593 1.00 4.87x10⁻³ 0.00 0.00 1.03x10⁻² 3.92 5.7% 3.3% 9.7% 16% 0.08% 0.00% 0.00% 0.17% 64% HLRW (kg) 2.56x10⁻⁴ 3.84x10⁻⁵ 2.52x10⁻⁴ 1.98x10⁻⁴ 3.82x10⁻⁶ 0.00 0.00 2.01x10⁻⁵ 1.40x10⁻⁵ 33% 4.9% 32% 25% 0.49% 0.00% 0.00% 2.6% 1.8% ILLRW (kg) 1.24x10⁻⁴ 2.80x10⁻⁵ 1.97x10⁻⁴ 1.59x10⁻⁴ 2.96x10⁻⁶ 0.00 0.00 1.55x10⁻⁵ 6.47x10⁻⁶ 23% 5.3% 37% 30% 0.56% 0.00% 0.00% 2.9% 1.2% CRU (kg) 0.00 0.00 0.00 0.00 0.00 0.00 0.00 0.00 0.00 MR (kg) 0.00 0.00 0.00 0.00 7.87x10⁻³ 0.00 0.00 0.00 0.00 0.00% 0.00% 0.00% 0.00% 100% 0.00% 0.00% 0.00% 0.00% MER (kg) Neg. Neg. Neg. Neg. Neg. Neg. Neg. Neg. Neg. EE (MJ) Neg. Neg. Neg. Neg. Neg. Neg. Neg. Neg. Neg. INA = Indicator not assessed | Neg. = Negligible

Environmental Product Declaration Ecore International ………………………………………………………………………………………………..………………………………………………………………………………………………………………… 50 © 2020 SCSglobalServices.com Table 51. Life Cycle Impact Assessment (LCIA) results for the Ecore QT/ECOsilence - RBM flooring products over a 75-yr time horizon. Results reported in MJ are calculated using lower heating values. All values are rounded to three significant digits. Impact Category A1 A2 A3 A4 A5 B2 B4 C2 C4 CML-IA GWP (kg CO2 eq) 3.06 0.216 1.70 1.30 3.42x10⁻² 0.00 0.00 0.120 1.65 38% 2.7% 21% 16% 0.42% 0.00% 0.00% 1.5% 20% ODP (kg CFC-11 eq) 1.58x10⁻² 8.47x10⁻⁴ 6.40x10⁻³ 9.26x10⁻³ 1.43x10⁻⁴ 0.00 0.00 5.59x10⁻⁴ 3.93x10⁻⁴ 47% 2.5% 19% 28% 0.43% 0.00% 0.00% 1.7% 1.2% AP (kg SO2 eq) 7.18x10⁻³ 2.01x10⁻⁴ 3.42x10⁻³ 1.58x10⁻³ 4.06x10⁻⁵ 0.00 0.00 1.21x10⁻⁴ 8.32x10⁻³ 34% 0.96% 16% 7.6% 0.19% 0.00% 0.00% 0.58% 40% EP (kg (PO4)3- eq) 2.22x10⁻³ 2.94x10⁻⁵ 3.88x10⁻⁴ 2.79x10⁻⁴ 5.39x10⁻⁶ 0.00 0.00 1.85x10⁻⁵ 3.53x10⁻⁴ 67% 0.89% 12% 8.5% 0.16% 0.00% 0.00% 0.56% 11% POCP (kg C2H4 eq) 5.01x10⁻⁷ 3.79x10⁻⁸ 1.89x10⁻⁷ 2.25x10⁻⁷ 5.30x10⁻⁹ 0.00 0.00 2.08x10⁻⁸ 8.56x10⁻⁹ 51% 3.8% 19% 23% 0.54% 0.00% 0.00% 2.1% 0.87% ADPE (kg Sb eq) 1.02x10⁻⁷ 2.22x10⁻¹⁰ 6.71x10⁻⁷ 1.21x10⁻⁹ 8.49x10⁻¹² 0.00 0.00 3.27x10⁻¹¹ 1.68x10⁻¹⁰ 13% 0.03% 87% 0.16% 0.00% 0.00% 0.00% 0.00% 0.02% ADPF (MJ eq) 45.1 3.19 21.1 18.8 0.416 0.00 0.00 1.64 0.908 49% 3.5% 23% 21% 0.46% 0.00% 0.00% 1.8% 1.00% TRACI 2.1 GWP (kg CO2 eq) 3.07 0.215 1.66 1.30 3.39x10⁻² 0.00 0.00 0.119 1.48 39% 2.7% 21% 16% 0.43% 0.00% 0.00% 1.5% 19% ODP (kg CFC-11 eq) 1.60x10⁻² 9.92x10⁻⁴ 6.97x10⁻³ 1.03x10⁻² 1.77x10⁻⁴ 0.00 0.00 6.91x10⁻⁴ 9.22x10⁻⁴ 44% 2.8% 19% 29% 0.49% 0.00% 0.00% 1.9% 2.6% AP (kg SO2 eq) 1.40x10⁻² 2.52x10⁻⁴ 6.91x10⁻³ 1.58x10⁻³ 5.01x10⁻⁵ 0.00 0.00 9.08x10⁻⁵ 2.22x10⁻² 31% 0.56% 15% 3.5% 0.11% 0.00% 0.00% 0.20% 49% EP (kg N eq) 0.236 2.36x10⁻² 0.110 0.217 4.97x10⁻³ 0.00 0.00 1.95x10⁻² 8.46x10⁻³ 38% 3.8% 18% 35% 0.80% 0.00% 0.00% 3.2% 1.4% SFP (kg O3 eq) 5.54x10⁻⁷ 5.04x10⁻⁸ 2.18x10⁻⁷ 2.99x10⁻⁷ 7.06x10⁻⁹ 0.00 0.00 2.77x10⁻⁸ 1.13x10⁻⁸ 47% 4.3% 19% 26% 0.60% 0.00% 0.00% 2.4% 0.97% FFD (MJ eq) 4.46 0.428 2.50 2.54 5.89x10⁻² 0.00 0.00 0.232 0.107 43% 4.1% 24% 25% 0.57% 0.00% 0.00% 2.2% 1.0%
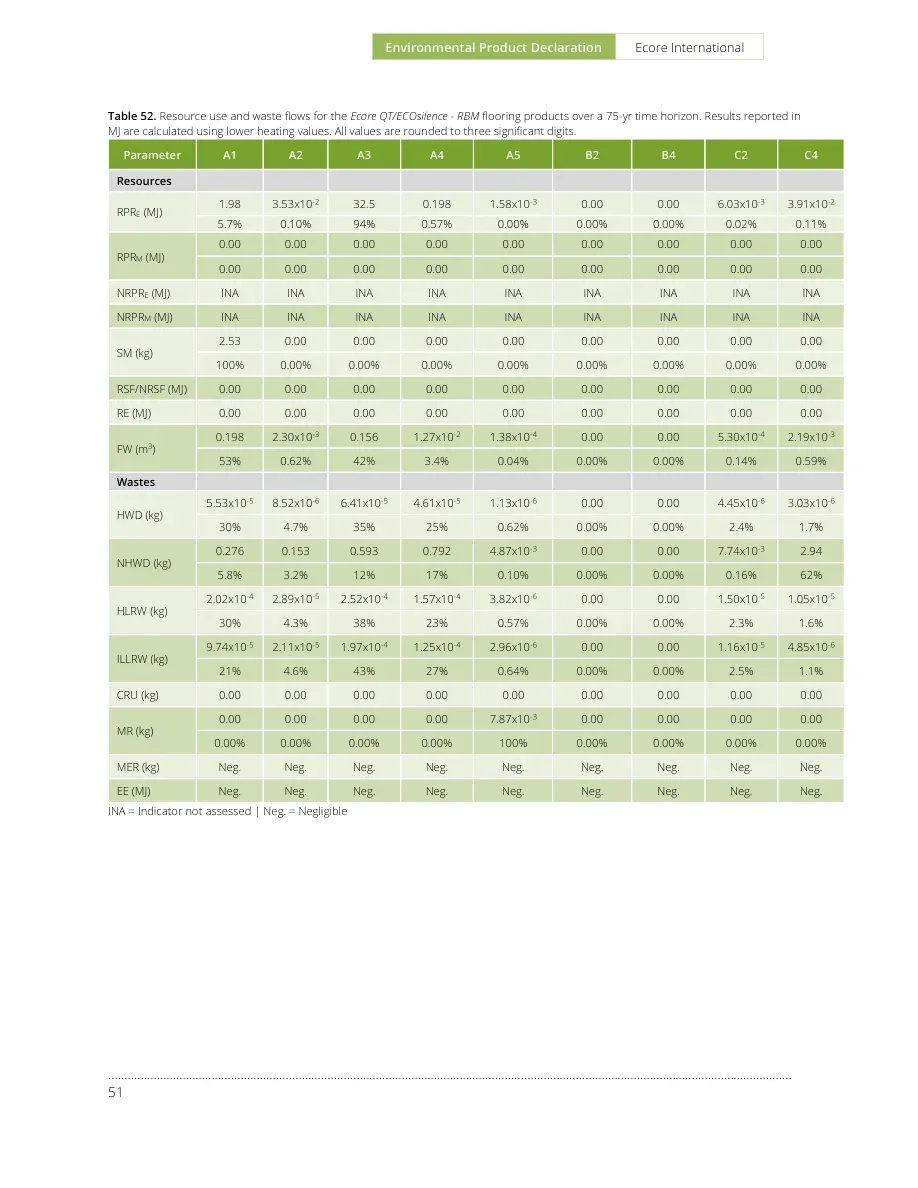
Environmental Product Declaration Ecore International ………………………………………………………………………………………………..………………………………………………………………………………………… 51 Table 52. Resource use and waste flows for the Ecore QT/ECOsilence - RBM flooring products over a 75-yr time horizon. Results reported in MJ are calculated using lower heating values. All values are rounded to three significant digits. Parameter A1 A2 A3 A4 A5 B2 B4 C2 C4 Resources RPRE (MJ) 1.98 3.53x10⁻² 32.5 0.198 1.58x10⁻³ 0.00 0.00 6.03x10⁻³ 3.91x10⁻² 5.7% 0.10% 94% 0.57% 0.00% 0.00% 0.00% 0.02% 0.11% RPRM (MJ) 0.00 0.00 0.00 0.00 0.00 0.00 0.00 0.00 0.00 0.00 0.00 0.00 0.00 0.00 0.00 0.00 0.00 0.00 NRPRE (MJ) INA INA INA INA INA INA INA INA INA NRPRM (MJ) INA INA INA INA INA INA INA INA INA SM (kg) 2.53 0.00 0.00 0.00 0.00 0.00 0.00 0.00 0.00 100% 0.00% 0.00% 0.00% 0.00% 0.00% 0.00% 0.00% 0.00% RSF/NRSF (MJ) 0.00 0.00 0.00 0.00 0.00 0.00 0.00 0.00 0.00 RE (MJ) 0.00 0.00 0.00 0.00 0.00 0.00 0.00 0.00 0.00 FW (m3) 0.198 2.30x10⁻³ 0.156 1.27x10⁻² 1.38x10⁻⁴ 0.00 0.00 5.30x10⁻⁴ 2.19x10⁻³ 53% 0.62% 42% 3.4% 0.04% 0.00% 0.00% 0.14% 0.59% Wastes HWD (kg) 5.53x10⁻⁵ 8.52x10⁻⁶ 6.41x10⁻⁵ 4.61x10⁻⁵ 1.13x10⁻⁶ 0.00 0.00 4.45x10⁻⁶ 3.03x10⁻⁶ 30% 4.7% 35% 25% 0.62% 0.00% 0.00% 2.4% 1.7% NHWD (kg) 0.276 0.153 0.593 0.792 4.87x10⁻³ 0.00 0.00 7.74x10⁻³ 2.94 5.8% 3.2% 12% 17% 0.10% 0.00% 0.00% 0.16% 62% HLRW (kg) 2.02x10⁻⁴ 2.89x10⁻⁵ 2.52x10⁻⁴ 1.57x10⁻⁴ 3.82x10⁻⁶ 0.00 0.00 1.50x10⁻⁵ 1.05x10⁻⁵ 30% 4.3% 38% 23% 0.57% 0.00% 0.00% 2.3% 1.6% ILLRW (kg) 9.74x10⁻⁵ 2.11x10⁻⁵ 1.97x10⁻⁴ 1.25x10⁻⁴ 2.96x10⁻⁶ 0.00 0.00 1.16x10⁻⁵ 4.85x10⁻⁶ 21% 4.6% 43% 27% 0.64% 0.00% 0.00% 2.5% 1.1% CRU (kg) 0.00 0.00 0.00 0.00 0.00 0.00 0.00 0.00 0.00 MR (kg) 0.00 0.00 0.00 0.00 7.87x10⁻³ 0.00 0.00 0.00 0.00 0.00% 0.00% 0.00% 0.00% 100% 0.00% 0.00% 0.00% 0.00% MER (kg) Neg. Neg. Neg. Neg. Neg. Neg. Neg. Neg. Neg. EE (MJ) Neg. Neg. Neg. Neg. Neg. Neg. Neg. Neg. Neg. INA = Indicator not assessed | Neg. = Negligible
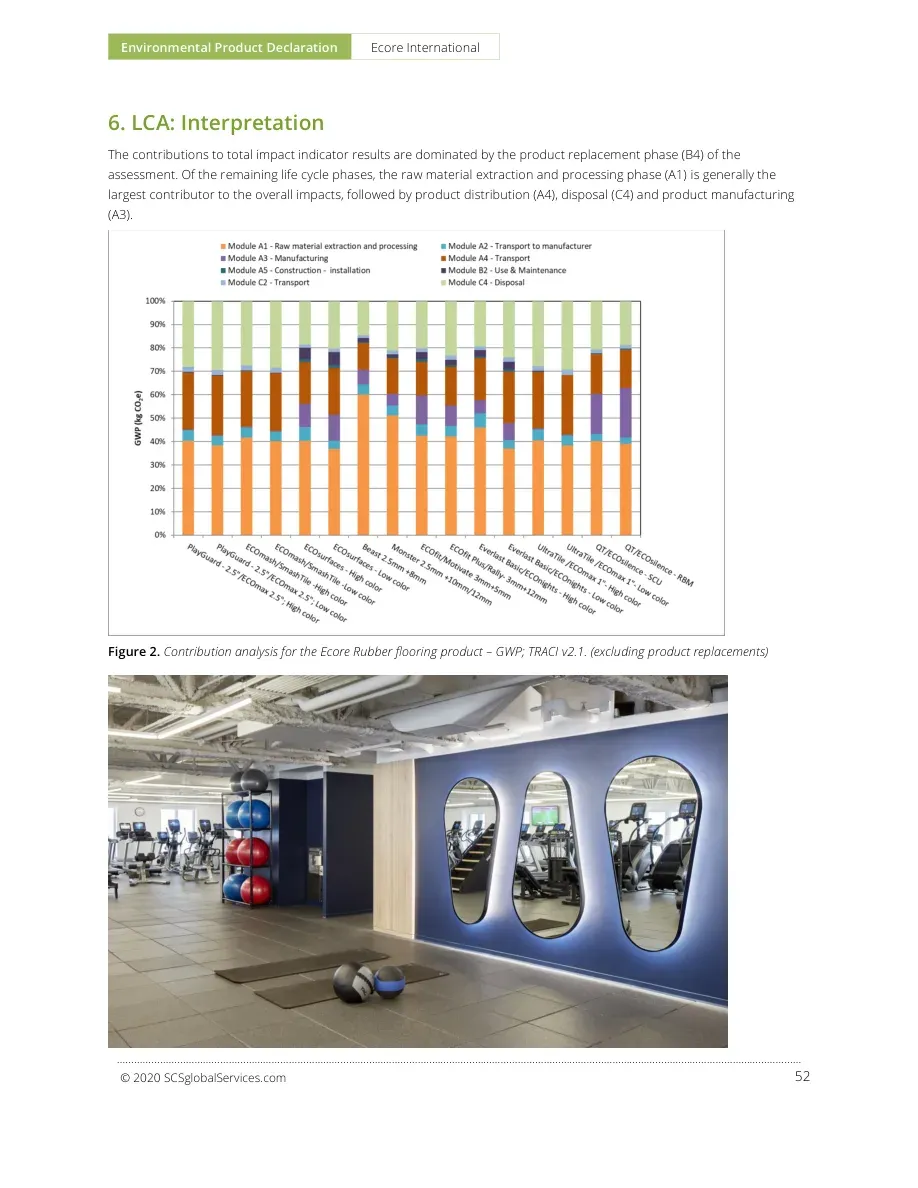
Environmental Product Declaration Ecore International ………………………………………………………………………………………………..………………………………………………………………………………………………………………… 52 © 2020 SCSglobalServices.com 6. LCA: Interpretation The contributions to total impact indicator results are dominated by the product replacement phase (B4) of the assessment. Of the remaining life cycle phases, the raw material extraction and processing phase (A1) is generally the largest contributor to the overall impacts, followed by product distribution (A4), disposal (C4) and product manufacturing (A3). Figure 2. Contribution analysis for the Ecore Rubber flooring product – GWP; TRACI v2.1. (excluding product replacements)
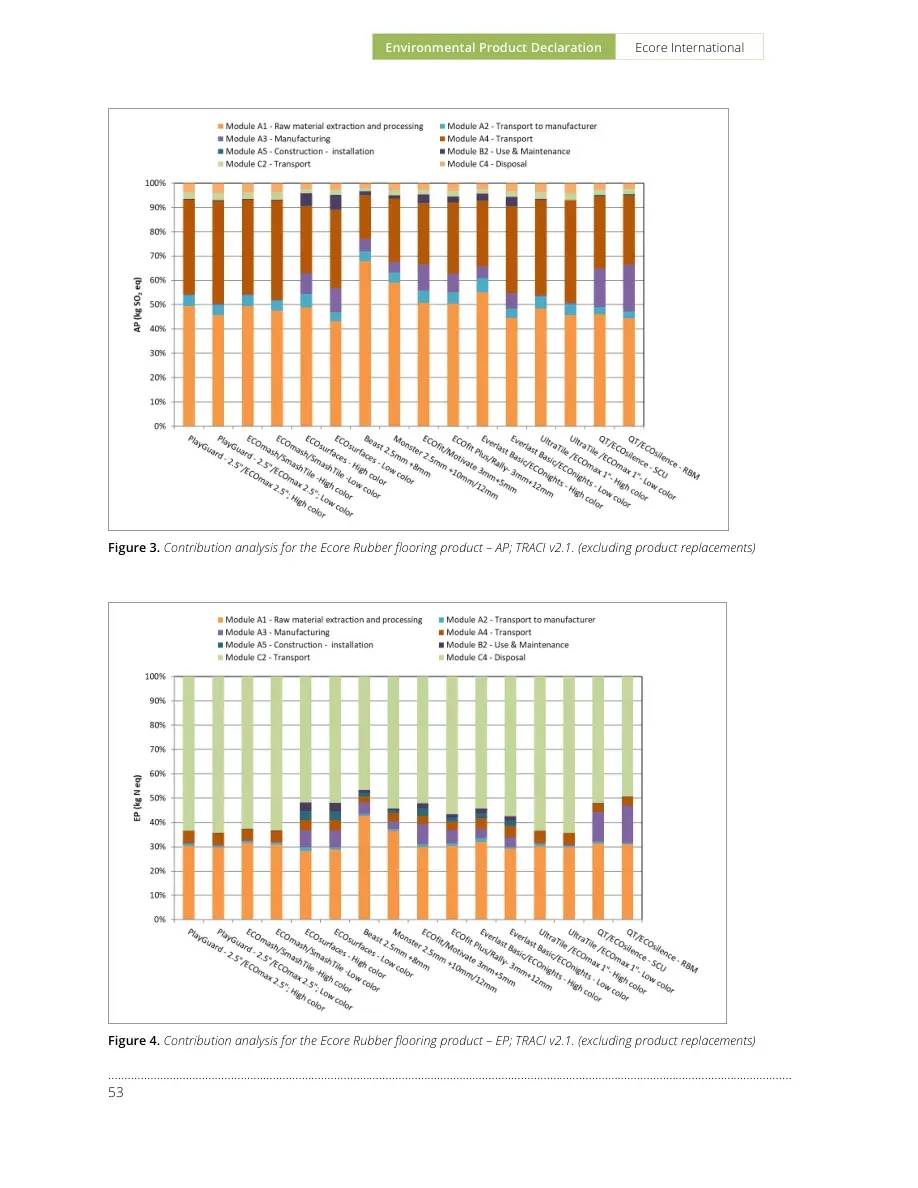
Environmental Product Declaration Ecore International ………………………………………………………………………………………………..………………………………………………………………………………………… 53 Figure 3. Contribution analysis for the Ecore Rubber flooring product – AP; TRACI v2.1. (excluding product replacements) Figure 4. Contribution analysis for the Ecore Rubber flooring product – EP; TRACI v2.1. (excluding product replacements)
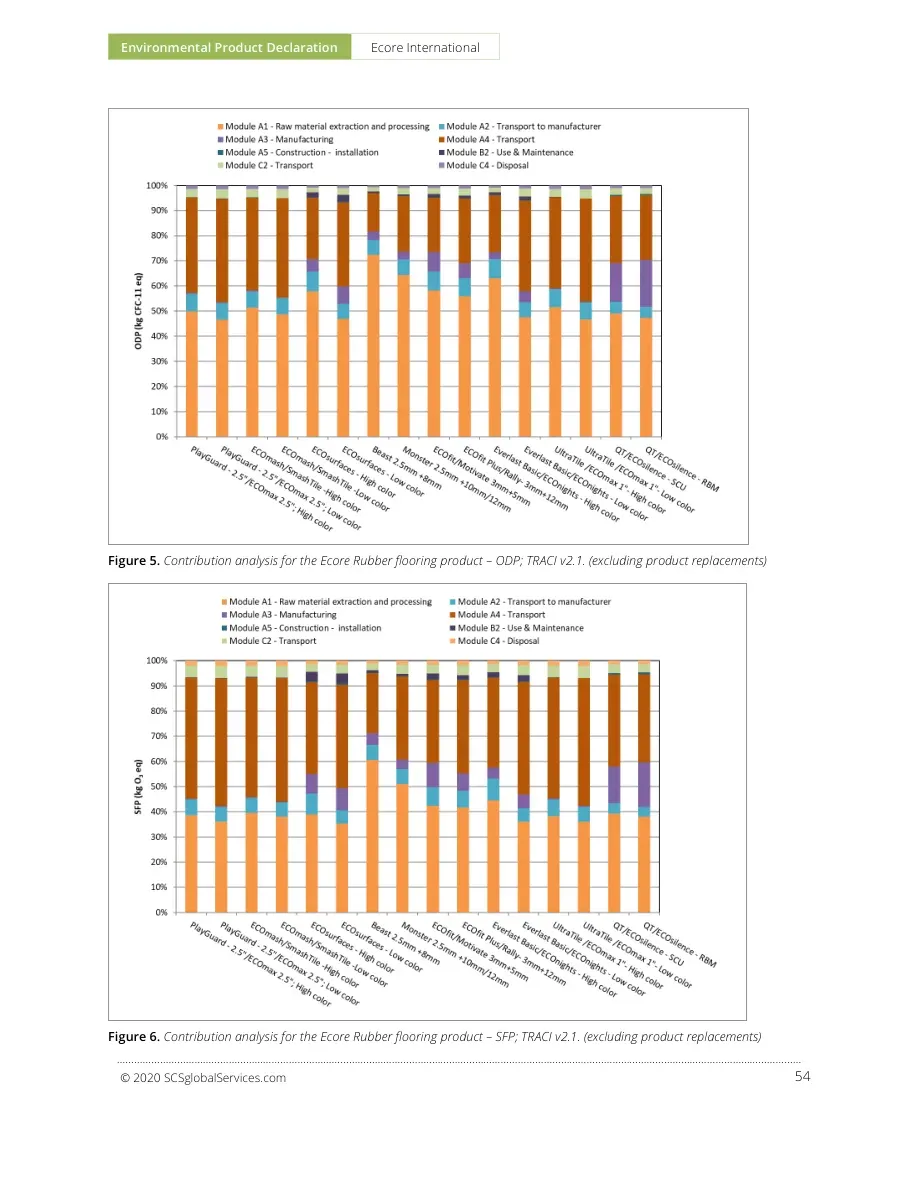
Environmental Product Declaration Ecore International ………………………………………………………………………………………………..………………………………………………………………………………………………………………… 54 © 2020 SCSglobalServices.com Figure 5. Contribution analysis for the Ecore Rubber flooring product – ODP; TRACI v2.1. (excluding product replacements) Figure 6. Contribution analysis for the Ecore Rubber flooring product – SFP; TRACI v2.1. (excluding product replacements)
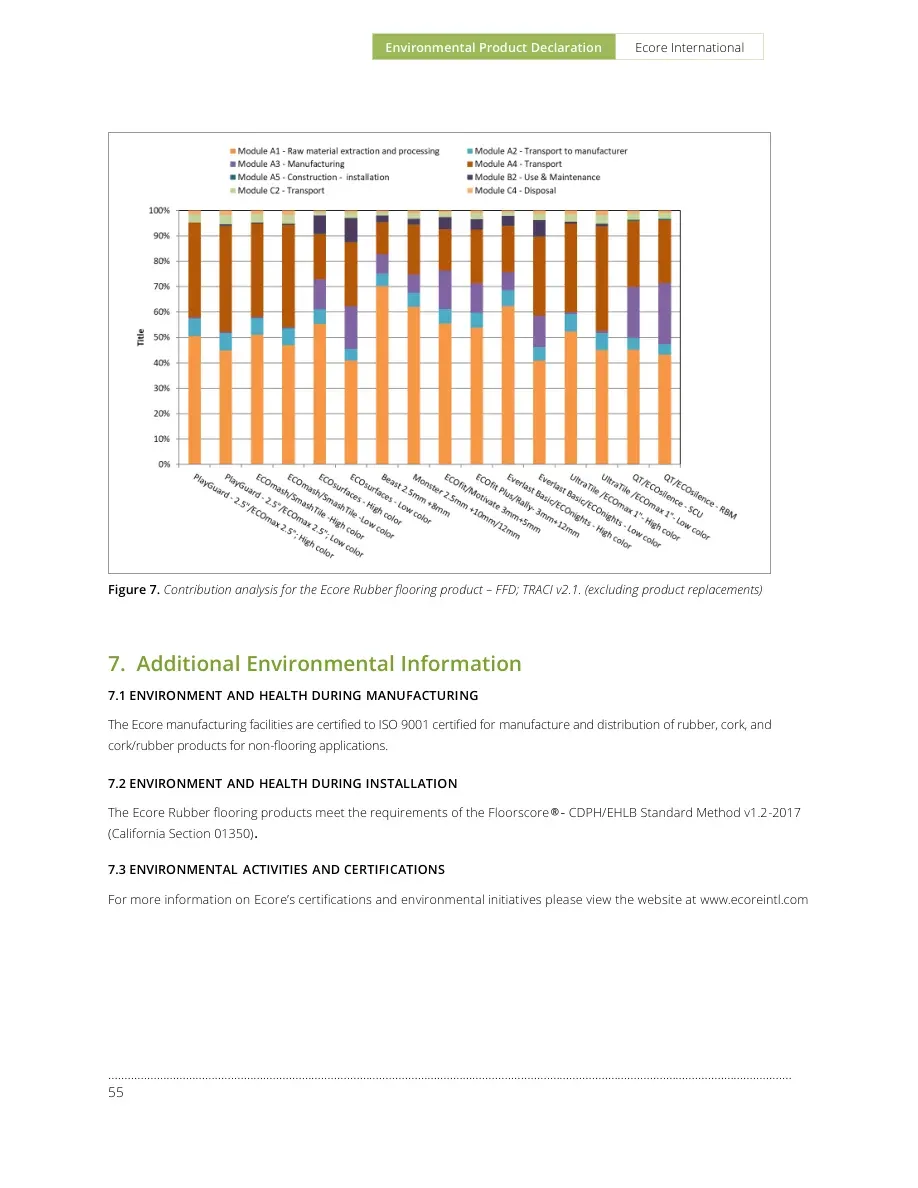
Environmental Product Declaration Ecore International ………………………………………………………………………………………………..………………………………………………………………………………………… 55 Figure 7. Contribution analysis for the Ecore Rubber flooring product – FFD; TRACI v2.1. (excluding product replacements) 7. Additional Environmental Information 7.1 ENVIRONMENT AND HEALTH DURING MANUFACTURING The Ecore manufacturing facilities are certified to ISO 9001 certified for manufacture and distribution of rubber, cork, and cork/rubber products for non-flooring applications. 7.2 ENVIRONMENT AND HEALTH DURING INSTALLATION The Ecore Rubber flooring products meet the requirements of the Floorscore®- CDPH/EHLB Standard Method v1.2-2017 (California Section 01350). 7.3 ENVIRONMENTAL ACTIVITIES AND CERTIFICATIONS For more information on Ecore’s certifications and environmental initiatives please view the website at www.ecoreintl.com
Environmental Product Declaration Ecore International ………………………………………………………………………………………………..………………………………………………………………………………………………………………… 56 © 2020 SCSglobalServices.com 8. References 1. Life Cycle Assessment of Ecore International’s Rubber Tile and Rolled Flooring. Prepared for Ecore International. May 2020. 2. ISO 14025:2006 Environmental labels and declarations – Type III environmental declarations – Principles and Procedures. 3. ISO 14040: 2006 Environmental Management – Life cycle assessment – Principles and Framework 4. ISO 14044: 2006 Environmental Management – Life cycle assessment – Requirements and Guidelines. 5. PCR Guidance for Building-Related Products and Services Part A: Life Cycle Assessment Calculation Rules and Report Requirements. Version 3.2. UL Environment. Sept. 2018 6. PCR Guidance for Building-Related Products and Services Part B: Flooring EPD Requirements. Version 2. UL Environment. May 2018. 7. SCS Type III Environmental Declaration Program: Program Operator Manual. V10.0 April 2019. SCS Global Services. 8. Tool for the Reduction and Assessment of Chemical and Other Environmental Impacts (TRACI). Dr. Bare, J., http://www.epa.gov/nrmrl/std/traci/traci.html 9. CML-IA Characterization Factors. Leiden University, Institute of Environmental Sciences. April 2013. http://cml.leiden.edu/software/data-cmlia.html 10. Ecoinvent Centre (2019) ecoinvent data from v3.6. Swiss Center for Life Cycle Inventories, Dübendorf, 2019, http://www.ecoinvent.org 11. European Joint Research Commission. International Reference Life Cycle Data System handbook. General guide for Life Cycle Assessment – Detailed Guidance. © European Union, 2010. 12. “WARM Model Transportation Research – Draft.” Memorandum from ICF Consulting to United States Environmental Protection Agency. September 7, 2004. http://epa.gov/epawaste/conserve/tools/warm/SWMGHGreport.html#background.
© 2020 SCSglobalServices.com For more information, contact: Ecore International 715 Fountain Avenue Lancaster, PA 17601 main +717.295.3400 | fax +800.322.1923 | www.ecoreintl.com SCS Global Services 2000 Powell Street, Ste. 600, Emeryville, CA 94608 USA Main +1.510.452.8000 | fax +1.510.452.8001