© 2025 SCSglobalServices.com Environmental Product Declaration Ecore International | Rubber Flooring Declaration Owner Ecore International 715 Fountain Avenue Lancaster, PA 17601 main +717.295.3400 | fax +800.322.1923 | www.ecoreintl.com Product ECOdB/Performance dBTile – Low color ECOdB/Performance dBTile – High color ECOfit Plus/Performance Rally ECOfit/Performance Motivate ECOsurfaces Classic – Low color ECOsurfaces Classic – High color Fit Collection/ECOnights – Low color Fit Collection/ECOnights – High color Performance UltraTile /ECOmax 1" – Low color Performance UltraTile /ECOmax 1" – High color PlayGuard - 2.5"/ECOmax 2.5" – Low color PlayGuard - 2.5"/ECOmax 2.5" – High color QT/ECOsilence (UNSPSC Class Code 30161705; CSI Masterformat code 09 65 19.33) EPD represents delivery of product to customers globally. Functional Unit The functional unit is one square meter of flooring covering installed and maintained for use over a 75-year period EPD Number and Period of Validity SCS-EPD-10378 EPD Valid April 28, 2025 through April 27, 2030 Product Category Rule PCR for Building-Related Products and Services - Part A: LCA Calculation Rules and Report Requirements, UL 10010, UL v.4.0, March 2022. PCR Guidance for Building-Related Products and Services - Flooring EPD Requirements, v.2.0, validity extended to July 1, 2025. Program Operator SCS Global Services 2000 Powell Street, Ste. 600, Emeryville, CA 94608 +1.510.452.8000 | www.SCSglobalServices.com
Environmental Product Declaration Ecore International | Rubber Flooring ………………………………………………………………………………………………..………………………………………………………………………………………… 1 © 2025 SCSglobalServices.com Declaration Owner: Ecore International Address: 715 Fountain Avenue, Lancaster, PA 17601, United States Declaration Number: SCS-EPD-10378 Declaration Validity Period: EPD Valid April 28, 2025 through April 27, 2030 Program Operator: SCS Global Services Declaration URL Link: https://www.scsglobalservices.com/certified-green-products-guide LCA Practitioner: Gerard Mansell, Ph.D., SCS Global Services LCA Software and LCI database: OpenLCA 2.4 software and the Ecoinvent v3.11 database Product RSL: Various Markets of Applicability: Global EPD Type: Product-Specific EPD Scope: Cradle-to-Grave LCIA Method and Version: CML-IA and TRACI 2.1 Independent critical review of the LCA and data, according to ISO 14044 and ISO 14071 ☐ internal ☒ external LCA Reviewer: Lindita Bushi, Ph.D., Athena Sustainable Materials Institute Part A Product Category Rule: PCR for Building-Related Products and Services - Part A: LCA Calculation Rules and Report Requirements, UL 10010, UL v.4.0, March 2022 Part A PCR Review conducted by: Lindita Bushi, PhD (Chair); Hugues Imbeault-Tétreault, ing., M.Sc.A.; Jack Geibig Part B Product Category Rule: PCR Guidance for Building-Related Products and Services - Flooring EPD Requirements, v.2.0, validity extended to July 1, 2025 Part B PCR Review conducted by: Jack Geibig (chair), Ecoform; Thomas Gloria, Industrial Ecology Consultants; Thaddeus Owen Independent verification of the declaration and data, according to ISO 14025 and the PCR ☐ internal ☒ external EPD Verifier: Lindita Bushi, Ph.D., Athena Sustainable Materials Institute Declaration Contents: 1. Ecore International ....................................................................................... 2 2. Product ............................................................................................................ 2 3. LCA: Calculation Rules .................................................................................. 9 4. LCA: Scenarios and Additional Technical Information........................ 16 5. LCA: Results .................................................................................................. 21 6. LCA: Interpretation ..................................................................................... 48 7. Additional Environmental Information.................................................. 48 8. References .................................................................................................... 49 Disclaimers: This EPD conforms to ISO 14025, 14040, 14044, and 21930. Scope of Results Reported: The PCR requirements limit the scope of the LCA metrics such that the results exclude environmental and social performance benchmarks and thresholds, and exclude impacts from the depletion of natural resources, land use ecological impacts, ocean impacts related to greenhouse gas emissions, risks from hazardous wastes and impacts linked to hazardous chemical emissions. Accuracy of Results: Due to PCR constraints, this EPD provides estimations of potential impacts that are inherently limited in terms of accuracy. Comparability: The PCR this EPD was based on was not written to support comparative assertions. EPDs based on different PCRs, or different calculation models, may not be comparable. When attempting to compare EPDs or life cycle impacts of products from different companies, the user should be aware of the uncertainty in the final results, due to and not limited to, the practitioner’s assumptions, the source of the data used in the study, and the specifics of the product modeled. In accordance with ISO 21930:2017, EPDs are comparable only if they comply with the core PCR, use the same sub-category PCR where applicable, include all relevant information modules and are based on equivalent scenarios with respect to the context of construction works. The owner of the declaration shall be liable for the underlying information and evidence; SCS shall not be liable with respect to manufacturer information, life cycle assessment data, and evidence supplied or made available to SCS.
Environmental Product Declaration Ecore International | Rubber Flooring ………………………………………………………………………………………………..…………………………………………………………………………………………………………… 2 1. Ecore International Ecore is a transformational rubber circularity company. Built on a legacy that began in 1871, we are leading our industry’s circular economy founded on the magic of rubber - a material with a proven past and the potential to reinvent the future. Like rubber itself, we are constantly flexing and finding new challenges to solve, new performance properties to engineer and new uses for this infinitely reusable material. Headquartered in Lancaster, Pa., Ecore serves customers in more than 75 countries, designing innovative technologies and solutions for many industries, including rubber reclamation services, rubber materials, commercial and performance flooring, play surfacing, industrial components, transportation, and agricultural products. Ecore brands include Ecore Athletic, ECOsurfaces, Centaur, QT Sound Insulation, A-Turf, Surface America, SpectraTurf, Ecore Industrial, Ecore Reclamation, Ecore Materials, itsTRU® Technology, and TRUcircularity™. 2. Product 2.1 PRODUCT DESCRIPTION Product Representative Thickness Manufacturing Location Product Description QT/ ECOsilence 5.0 York, PA; Lancaster, PA; Ozark, AL QT Sound Insulation is a high-quality sound control underlayment. QT is backed by hundreds of acoustical tests and a team of acoustical engineers to help you provide the right acoustic solution. ECOsilence is produced in a variety of thicknesses and is engineered for use directly under most floor finishes. This product helps to exceed impact sound insulation class requirements while maintaining a low profile. Performance UltraTile/ ECOmax 1"- Low color 25.4 Lancaster, PA From light strength and conditioning to Olympic-style lifting, our Performance collection has the technology and performance athletes need to perform their best. Durable, slip resistant, and shock absorbent, our athletic surfaces are designed to meet a range of athletic activities. The Performance Collection includes Motivate, Motivate Plus, Rally, Beast, Beast Plus, Monster, Modzilla System (Mod 15 & Mod 32), UltraTile, and dBTile. Performance UltraTile / ECOmax 1"- High color 25.4 Lancaster, PA ECOmax for Fitness is a square, beveled tile with a patented footed system. The 1-inch molded tile is designed specifically for use in weight rooms. The 2.5" Live and Play Surfaces tiles provide exceptional safety characteristics to outdoor areas. Fit Collection/ ECOnights - Low color 8.0 York, PA; Lancaster, PA; Ozark, AL The Fit Collection is the “original” recycled composition rubber fitness floor. This durable surface sets the standard for performance, quality, and affordability. ECOnights is the perfect surface for corporate guests and hospitality fitness centers. Fit Collection/ ECOnights - High color 8.0 York, PA; Lancaster, PA; Ozark, AL ECOfit Plus/ Performance Rally 14.5 York, PA ECOfit Plus offers a prescription for comfort. Whether in a traditional health and fitness application or an active work environment, it provides enhanced performance while mitigating fatigue. The key is the dynamic energy return, which forces the user to stay off their heels and on the balls of their feet. ECOfit/ Performance Motivate 8.2 York, PA ECOfit is designed for bodies in motion. This 8.2mm vulcanized composition rubber engineered floor provides enhanced performance while mitigating fatigue and the risk of injury.
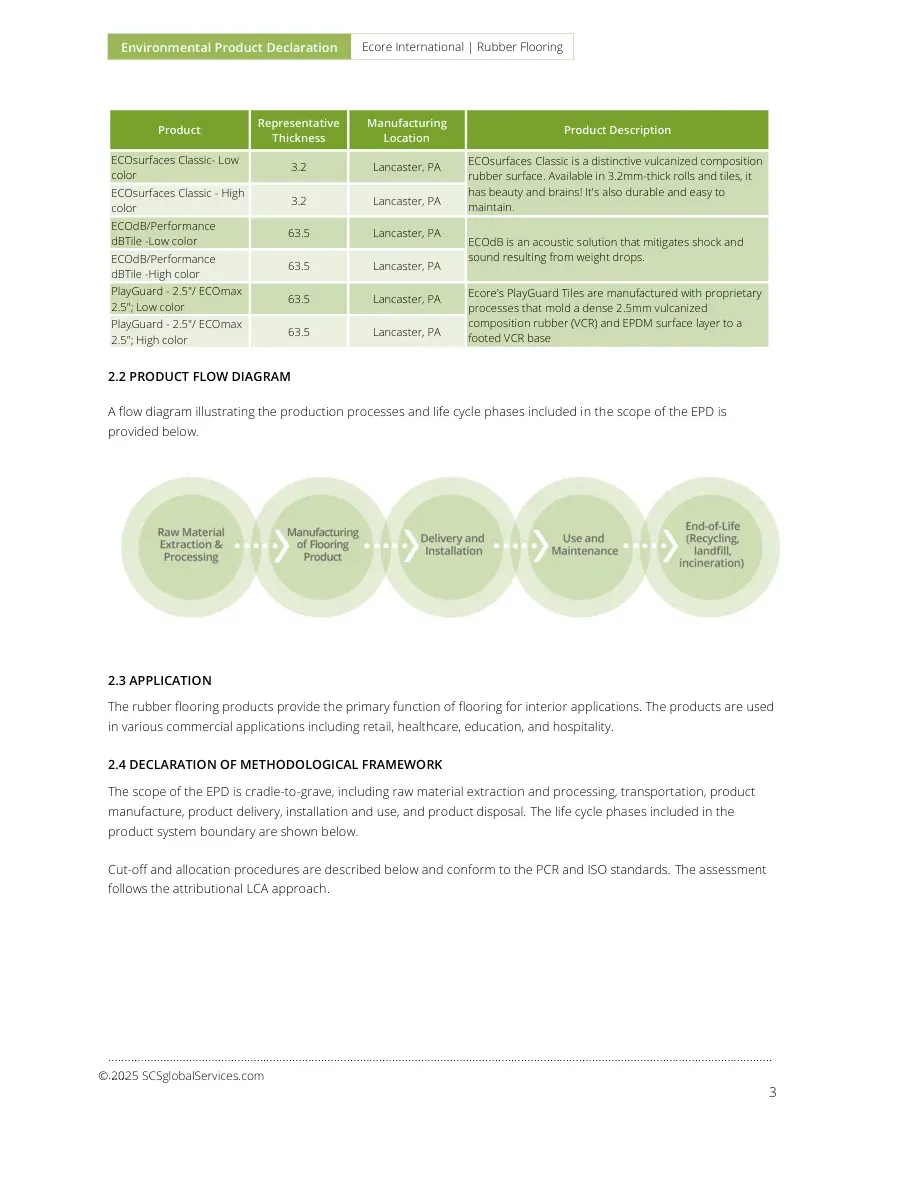
Environmental Product Declaration Ecore International | Rubber Flooring ………………………………………………………………………………………………..………………………………………………………………………………………… 3 © 2025 SCSglobalServices.com Product Representative Thickness Manufacturing Location Product Description ECOsurfaces Classic- Low color 3.2 Lancaster, PA ECOsurfaces Classic is a distinctive vulcanized composition rubber surface. Available in 3.2mm-thick rolls and tiles, it has beauty and brains! It's also durable and easy to maintain. ECOsurfaces Classic - High color 3.2 Lancaster, PA ECOdB/Performance dBTile -Low color 63.5 Lancaster, PA ECOdB is an acoustic solution that mitigates shock and sound resulting from weight drops. ECOdB/Performance dBTile -High color 63.5 Lancaster, PA PlayGuard - 2.5"/ ECOmax 2.5"; Low color 63.5 Lancaster, PA Ecore's PlayGuard Tiles are manufactured with proprietary processes that mold a dense 2.5mm vulcanized composition rubber (VCR) and EPDM surface layer to a footed VCR base PlayGuard - 2.5"/ ECOmax 2.5"; High color 63.5 Lancaster, PA 2.2 PRODUCT FLOW DIAGRAM A flow diagram illustrating the production processes and life cycle phases included in the scope of the EPD is provided below. 2.3 APPLICATION The rubber flooring products provide the primary function of flooring for interior applications. The products are used in various commercial applications including retail, healthcare, education, and hospitality. 2.4 DECLARATION OF METHODOLOGICAL FRAMEWORK The scope of the EPD is cradle-to-grave, including raw material extraction and processing, transportation, product manufacture, product delivery, installation and use, and product disposal. The life cycle phases included in the product system boundary are shown below. Cut-off and allocation procedures are described below and conform to the PCR and ISO standards. The assessment follows the attributional LCA approach.
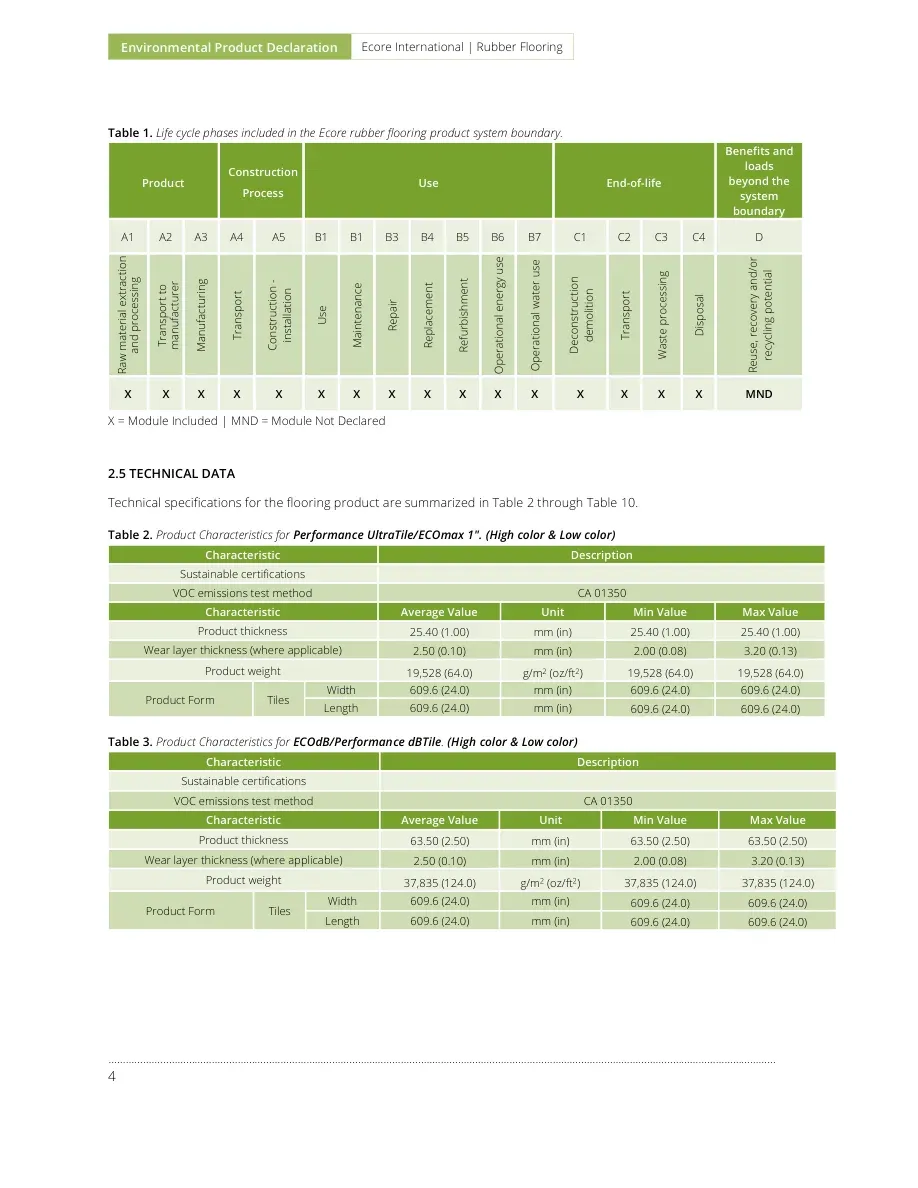
Environmental Product Declaration Ecore International | Rubber Flooring ………………………………………………………………………………………………..…………………………………………………………………………………………………………… 4 Table 1. Life cycle phases included in the Ecore rubber flooring product system boundary. Product Construction Process Use End-of-life Benefits and loads beyond the system boundary A1 A2 A3 A4 A5 B1 B1 B3 B4 B5 B6 B7 C1 C2 C3 C4 D Raw material extraction and processing Transport to manufacturer Manufacturing Transport Construction - installation Use Maintenance Repair Replacement Refurbishment Operational energy use Operational water use Deconstruction demolition Transport Waste processing Disposal Reuse, recovery and/or recycling potential X X X X X X X X X X X X X X X X MND X = Module Included | MND = Module Not Declared 2.5 TECHNICAL DATA Technical specifications for the flooring product are summarized in Table 2 through Table 10. Table 2. Product Characteristics for Performance UltraTile/ECOmax 1". (High color & Low color) Characteristic Description Sustainable certifications VOC emissions test method CA 01350 Characteristic Average Value Unit Min Value Max Value Product thickness 25.40 (1.00) mm (in) 25.40 (1.00) 25.40 (1.00) Wear layer thickness (where applicable) 2.50 (0.10) mm (in) 2.00 (0.08) 3.20 (0.13) Product weight 19,528 (64.0) g/m2 (oz/ft2) 19,528 (64.0) 19,528 (64.0) Product Form Tiles Width 609.6 (24.0) mm (in) 609.6 (24.0) 609.6 (24.0) Length 609.6 (24.0) mm (in) 609.6 (24.0) 609.6 (24.0) Table 3. Product Characteristics for ECOdB/Performance dBTile. (High color & Low color) Characteristic Description Sustainable certifications VOC emissions test method CA 01350 Characteristic Average Value Unit Min Value Max Value Product thickness 63.50 (2.50) mm (in) 63.50 (2.50) 63.50 (2.50) Wear layer thickness (where applicable) 2.50 (0.10) mm (in) 2.00 (0.08) 3.20 (0.13) Product weight 37,835 (124.0) g/m2 (oz/ft2) 37,835 (124.0) 37,835 (124.0) Product Form Tiles Width 609.6 (24.0) mm (in) 609.6 (24.0) 609.6 (24.0) Length 609.6 (24.0) mm (in) 609.6 (24.0) 609.6 (24.0)
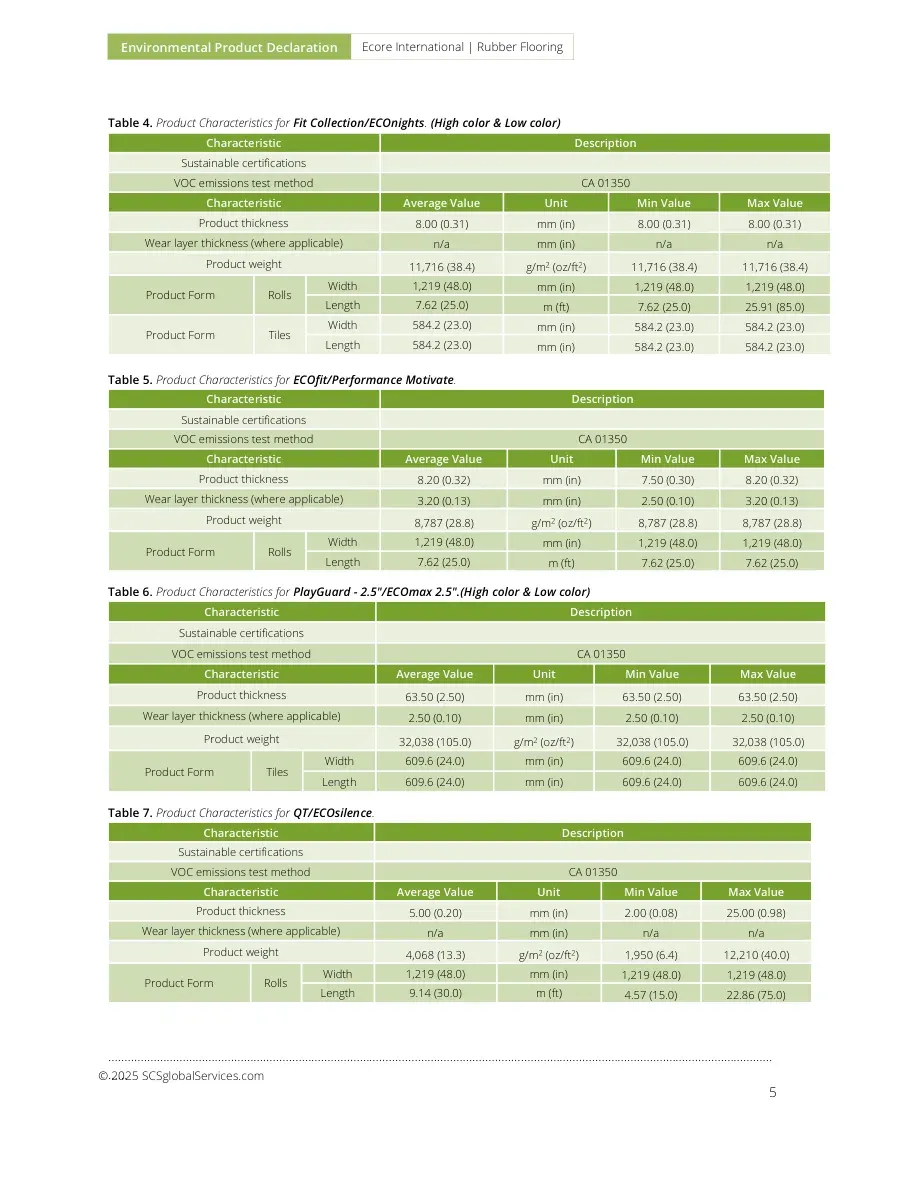
Environmental Product Declaration Ecore International | Rubber Flooring ………………………………………………………………………………………………..………………………………………………………………………………………… 5 © 2025 SCSglobalServices.com Table 4. Product Characteristics for Fit Collection/ECOnights. (High color & Low color) Characteristic Description Sustainable certifications VOC emissions test method CA 01350 Characteristic Average Value Unit Min Value Max Value Product thickness 8.00 (0.31) mm (in) 8.00 (0.31) 8.00 (0.31) Wear layer thickness (where applicable) n/a mm (in) n/a n/a Product weight 11,716 (38.4) g/m2 (oz/ft2) 11,716 (38.4) 11,716 (38.4) Product Form Rolls Width 1,219 (48.0) mm (in) 1,219 (48.0) 1,219 (48.0) Length 7.62 (25.0) m (ft) 7.62 (25.0) 25.91 (85.0) Product Form Tiles Width 584.2 (23.0) mm (in) 584.2 (23.0) 584.2 (23.0) Length 584.2 (23.0) mm (in) 584.2 (23.0) 584.2 (23.0) Table 5. Product Characteristics for ECOfit/Performance Motivate. Characteristic Description Sustainable certifications VOC emissions test method CA 01350 Characteristic Average Value Unit Min Value Max Value Product thickness 8.20 (0.32) mm (in) 7.50 (0.30) 8.20 (0.32) Wear layer thickness (where applicable) 3.20 (0.13) mm (in) 2.50 (0.10) 3.20 (0.13) Product weight 8,787 (28.8) g/m2 (oz/ft2) 8,787 (28.8) 8,787 (28.8) Product Form Rolls Width 1,219 (48.0) mm (in) 1,219 (48.0) 1,219 (48.0) Length 7.62 (25.0) m (ft) 7.62 (25.0) 7.62 (25.0) Table 6. Product Characteristics for PlayGuard - 2.5"/ECOmax 2.5".(High color & Low color) Characteristic Description Sustainable certifications VOC emissions test method CA 01350 Characteristic Average Value Unit Min Value Max Value Product thickness 63.50 (2.50) mm (in) 63.50 (2.50) 63.50 (2.50) Wear layer thickness (where applicable) 2.50 (0.10) mm (in) 2.50 (0.10) 2.50 (0.10) Product weight 32,038 (105.0) g/m2 (oz/ft2) 32,038 (105.0) 32,038 (105.0) Product Form Tiles Width 609.6 (24.0) mm (in) 609.6 (24.0) 609.6 (24.0) Length 609.6 (24.0) mm (in) 609.6 (24.0) 609.6 (24.0) Table 7. Product Characteristics for QT/ECOsilence. Characteristic Description Sustainable certifications VOC emissions test method CA 01350 Characteristic Average Value Unit Min Value Max Value Product thickness 5.00 (0.20) mm (in) 2.00 (0.08) 25.00 (0.98) Wear layer thickness (where applicable) n/a mm (in) n/a n/a Product weight 4,068 (13.3) g/m2 (oz/ft2) 1,950 (6.4) 12,210 (40.0) Product Form Rolls Width 1,219 (48.0) mm (in) 1,219 (48.0) 1,219 (48.0) Length 9.14 (30.0) m (ft) 4.57 (15.0) 22.86 (75.0)
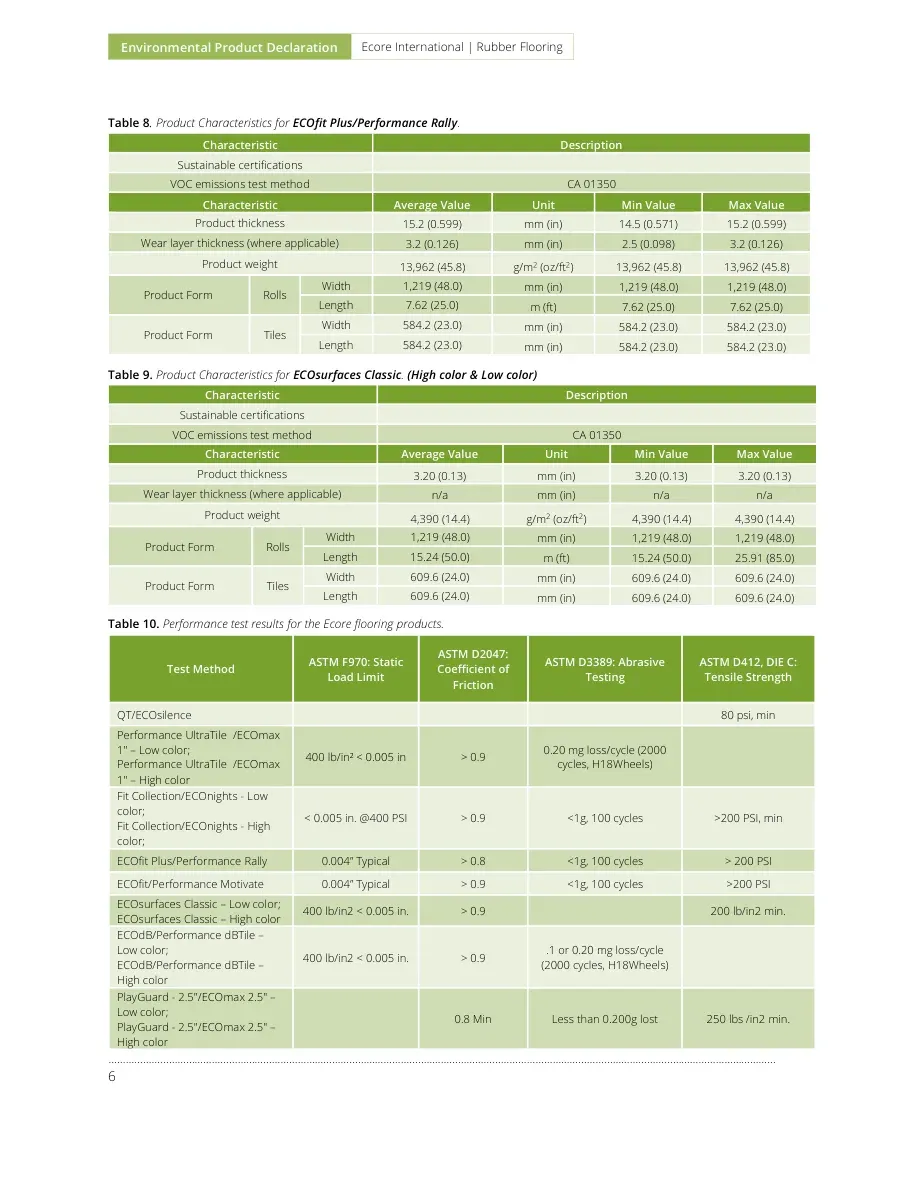
Environmental Product Declaration Ecore International | Rubber Flooring ………………………………………………………………………………………………..…………………………………………………………………………………………………………… 6 Table 8. Product Characteristics for ECOfit Plus/Performance Rally. Characteristic Description Sustainable certifications VOC emissions test method CA 01350 Characteristic Average Value Unit Min Value Max Value Product thickness 15.2 (0.599) mm (in) 14.5 (0.571) 15.2 (0.599) Wear layer thickness (where applicable) 3.2 (0.126) mm (in) 2.5 (0.098) 3.2 (0.126) Product weight 13,962 (45.8) g/m2 (oz/ft2) 13,962 (45.8) 13,962 (45.8) Product Form Rolls Width 1,219 (48.0) mm (in) 1,219 (48.0) 1,219 (48.0) Length 7.62 (25.0) m (ft) 7.62 (25.0) 7.62 (25.0) Product Form Tiles Width 584.2 (23.0) mm (in) 584.2 (23.0) 584.2 (23.0) Length 584.2 (23.0) mm (in) 584.2 (23.0) 584.2 (23.0) Table 9. Product Characteristics for ECOsurfaces Classic. (High color & Low color) Characteristic Description Sustainable certifications VOC emissions test method CA 01350 Characteristic Average Value Unit Min Value Max Value Product thickness 3.20 (0.13) mm (in) 3.20 (0.13) 3.20 (0.13) Wear layer thickness (where applicable) n/a mm (in) n/a n/a Product weight 4,390 (14.4) g/m2 (oz/ft2) 4,390 (14.4) 4,390 (14.4) Product Form Rolls Width 1,219 (48.0) mm (in) 1,219 (48.0) 1,219 (48.0) Length 15.24 (50.0) m (ft) 15.24 (50.0) 25.91 (85.0) Product Form Tiles Width 609.6 (24.0) mm (in) 609.6 (24.0) 609.6 (24.0) Length 609.6 (24.0) mm (in) 609.6 (24.0) 609.6 (24.0) Table 10. Performance test results for the Ecore flooring products. Test Method ASTM F970: Static Load Limit ASTM D2047: Coefficient of Friction ASTM D3389: Abrasive Testing ASTM D412, DIE C: Tensile Strength QT/ECOsilence 80 psi, min Performance UltraTile /ECOmax 1" – Low color; Performance UltraTile /ECOmax 1" – High color 400 lb/in² < 0.005 in > 0.9 0.20 mg loss/cycle (2000 cycles, H18Wheels) Fit Collection/ECOnights - Low color; Fit Collection/ECOnights - High color; < 0.005 in. @400 PSI > 0.9 <1g, 100 cycles >200 PSI, min ECOfit Plus/Performance Rally 0.004” Typical > 0.8 <1g, 100 cycles > 200 PSI ECOfit/Performance Motivate 0.004” Typical > 0.9 <1g, 100 cycles >200 PSI ECOsurfaces Classic – Low color; ECOsurfaces Classic – High color 400 lb/in2 < 0.005 in. > 0.9 200 lb/in2 min. ECOdB/Performance dBTile – Low color; ECOdB/Performance dBTile – High color 400 lb/in2 < 0.005 in. > 0.9 .1 or 0.20 mg loss/cycle (2000 cycles, H18Wheels) PlayGuard - 2.5"/ECOmax 2.5" – Low color; PlayGuard - 2.5"/ECOmax 2.5" – High color 0.8 Min Less than 0.200g lost 250 lbs /in2 min.
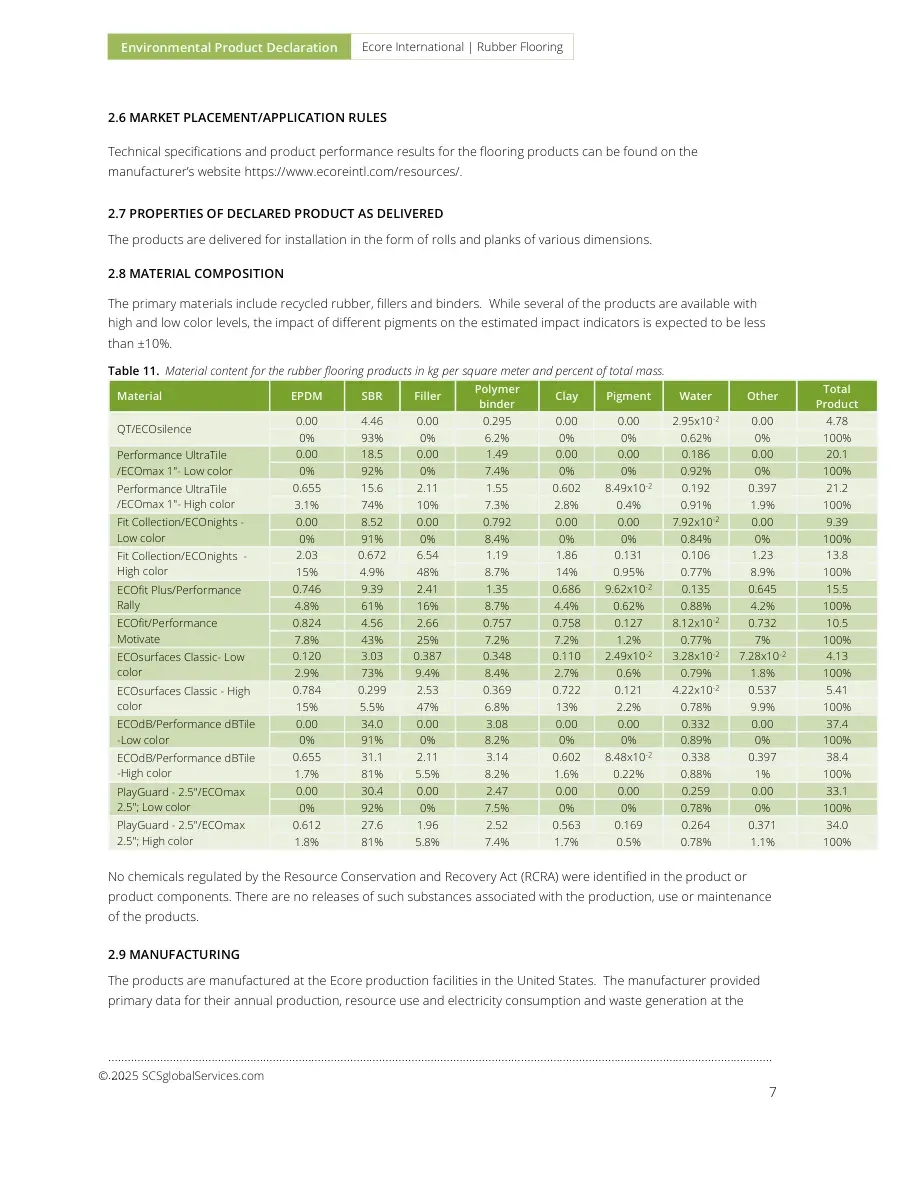
Environmental Product Declaration Ecore International | Rubber Flooring ………………………………………………………………………………………………..………………………………………………………………………………………… 7 © 2025 SCSglobalServices.com 2.6 MARKET PLACEMENT/APPLICATION RULES Technical specifications and product performance results for the flooring products can be found on the manufacturer’s website https://www.ecoreintl.com/resources/. 2.7 PROPERTIES OF DECLARED PRODUCT AS DELIVERED The products are delivered for installation in the form of rolls and planks of various dimensions. 2.8 MATERIAL COMPOSITION The primary materials include recycled rubber, fillers and binders. While several of the products are available with high and low color levels, the impact of different pigments on the estimated impact indicators is expected to be less than ±10%. Table 11. Material content for the rubber flooring products in kg per square meter and percent of total mass. Material EPDM SBR Filler Polymer binder Clay Pigment Water Other Total Product QT/ECOsilence 0.00 4.46 0.00 0.295 0.00 0.00 2.95x10⁻² 0.00 4.78 0% 93% 0% 6.2% 0% 0% 0.62% 0% 100% Performance UltraTile /ECOmax 1"- Low color 0.00 18.5 0.00 1.49 0.00 0.00 0.186 0.00 20.1 0% 92% 0% 7.4% 0% 0% 0.92% 0% 100% Performance UltraTile /ECOmax 1"- High color 0.655 15.6 2.11 1.55 0.602 8.49x10⁻² 0.192 0.397 21.2 3.1% 74% 10% 7.3% 2.8% 0.4% 0.91% 1.9% 100% Fit Collection/ECOnights - Low color 0.00 8.52 0.00 0.792 0.00 0.00 7.92x10⁻² 0.00 9.39 0% 91% 0% 8.4% 0% 0% 0.84% 0% 100% Fit Collection/ECOnights - High color 2.03 0.672 6.54 1.19 1.86 0.131 0.106 1.23 13.8 15% 4.9% 48% 8.7% 14% 0.95% 0.77% 8.9% 100% ECOfit Plus/Performance Rally 0.746 9.39 2.41 1.35 0.686 9.62x10⁻² 0.135 0.645 15.5 4.8% 61% 16% 8.7% 4.4% 0.62% 0.88% 4.2% 100% ECOfit/Performance Motivate 0.824 4.56 2.66 0.757 0.758 0.127 8.12x10⁻² 0.732 10.5 7.8% 43% 25% 7.2% 7.2% 1.2% 0.77% 7% 100% ECOsurfaces Classic- Low color 0.120 3.03 0.387 0.348 0.110 2.49x10⁻² 3.28x10⁻² 7.28x10⁻² 4.13 2.9% 73% 9.4% 8.4% 2.7% 0.6% 0.79% 1.8% 100% ECOsurfaces Classic - High color 0.784 0.299 2.53 0.369 0.722 0.121 4.22x10⁻² 0.537 5.41 15% 5.5% 47% 6.8% 13% 2.2% 0.78% 9.9% 100% ECOdB/Performance dBTile -Low color 0.00 34.0 0.00 3.08 0.00 0.00 0.332 0.00 37.4 0% 91% 0% 8.2% 0% 0% 0.89% 0% 100% ECOdB/Performance dBTile -High color 0.655 31.1 2.11 3.14 0.602 8.48x10⁻² 0.338 0.397 38.4 1.7% 81% 5.5% 8.2% 1.6% 0.22% 0.88% 1% 100% PlayGuard - 2.5"/ECOmax 2.5"; Low color 0.00 30.4 0.00 2.47 0.00 0.00 0.259 0.00 33.1 0% 92% 0% 7.5% 0% 0% 0.78% 0% 100% PlayGuard - 2.5"/ECOmax 2.5"; High color 0.612 27.6 1.96 2.52 0.563 0.169 0.264 0.371 34.0 1.8% 81% 5.8% 7.4% 1.7% 0.5% 0.78% 1.1% 100% No chemicals regulated by the Resource Conservation and Recovery Act (RCRA) were identified in the product or product components. There are no releases of such substances associated with the production, use or maintenance of the products. 2.9 MANUFACTURING The products are manufactured at the Ecore production facilities in the United States. The manufacturer provided primary data for their annual production, resource use and electricity consumption and waste generation at the
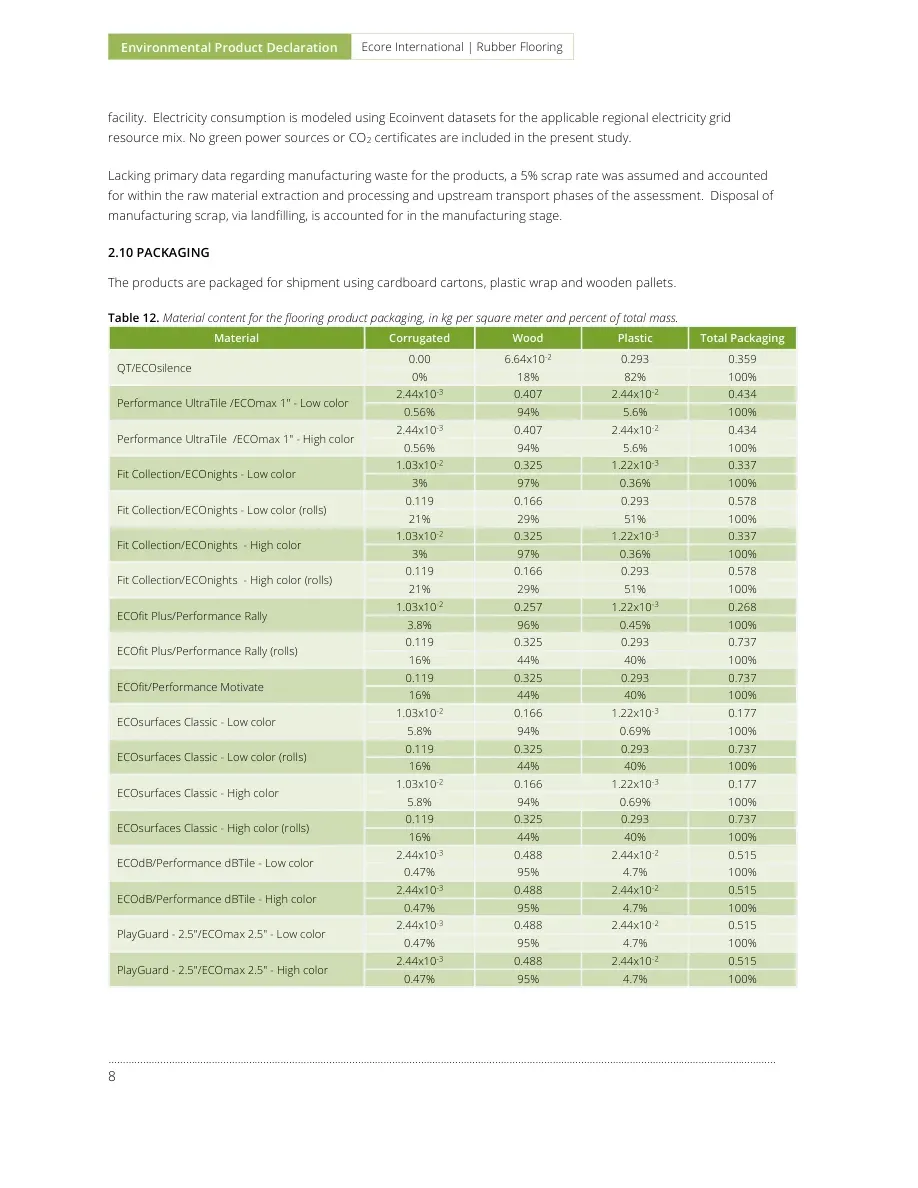
Environmental Product Declaration Ecore International | Rubber Flooring ………………………………………………………………………………………………..…………………………………………………………………………………………………………… 8 facility. Electricity consumption is modeled using Ecoinvent datasets for the applicable regional electricity grid resource mix. No green power sources or CO2 certificates are included in the present study. Lacking primary data regarding manufacturing waste for the products, a 5% scrap rate was assumed and accounted for within the raw material extraction and processing and upstream transport phases of the assessment. Disposal of manufacturing scrap, via landfilling, is accounted for in the manufacturing stage. 2.10 PACKAGING The products are packaged for shipment using cardboard cartons, plastic wrap and wooden pallets. Table 12. Material content for the flooring product packaging, in kg per square meter and percent of total mass. Material Corrugated Wood Plastic Total Packaging QT/ECOsilence 0.00 6.64x10⁻² 0.293 0.359 0% 18% 82% 100% Performance UltraTile /ECOmax 1" - Low color 2.44x10⁻³ 0.407 2.44x10⁻² 0.434 0.56% 94% 5.6% 100% Performance UltraTile /ECOmax 1" - High color 2.44x10⁻³ 0.407 2.44x10⁻² 0.434 0.56% 94% 5.6% 100% Fit Collection/ECOnights - Low color 1.03x10⁻² 0.325 1.22x10⁻³ 0.337 3% 97% 0.36% 100% Fit Collection/ECOnights - Low color (rolls) 0.119 0.166 0.293 0.578 21% 29% 51% 100% Fit Collection/ECOnights - High color 1.03x10⁻² 0.325 1.22x10⁻³ 0.337 3% 97% 0.36% 100% Fit Collection/ECOnights - High color (rolls) 0.119 0.166 0.293 0.578 21% 29% 51% 100% ECOfit Plus/Performance Rally 1.03x10⁻² 0.257 1.22x10⁻³ 0.268 3.8% 96% 0.45% 100% ECOfit Plus/Performance Rally (rolls) 0.119 0.325 0.293 0.737 16% 44% 40% 100% ECOfit/Performance Motivate 0.119 0.325 0.293 0.737 16% 44% 40% 100% ECOsurfaces Classic - Low color 1.03x10⁻² 0.166 1.22x10⁻³ 0.177 5.8% 94% 0.69% 100% ECOsurfaces Classic - Low color (rolls) 0.119 0.325 0.293 0.737 16% 44% 40% 100% ECOsurfaces Classic - High color 1.03x10⁻² 0.166 1.22x10⁻³ 0.177 5.8% 94% 0.69% 100% ECOsurfaces Classic - High color (rolls) 0.119 0.325 0.293 0.737 16% 44% 40% 100% ECOdB/Performance dBTile - Low color 2.44x10⁻³ 0.488 2.44x10⁻² 0.515 0.47% 95% 4.7% 100% ECOdB/Performance dBTile - High color 2.44x10⁻³ 0.488 2.44x10⁻² 0.515 0.47% 95% 4.7% 100% PlayGuard - 2.5"/ECOmax 2.5" - Low color 2.44x10⁻³ 0.488 2.44x10⁻² 0.515 0.47% 95% 4.7% 100% PlayGuard - 2.5"/ECOmax 2.5" - High color 2.44x10⁻³ 0.488 2.44x10⁻² 0.515 0.47% 95% 4.7% 100%
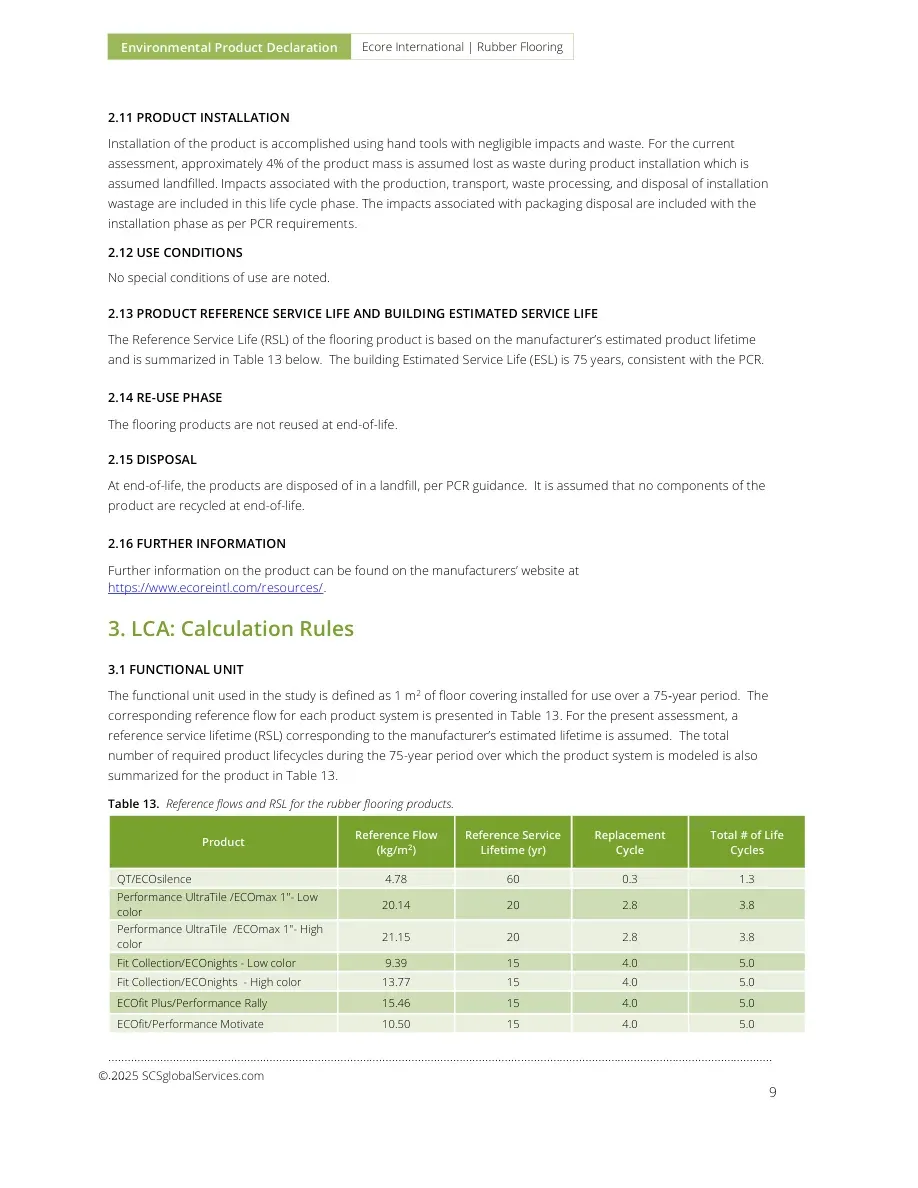
Environmental Product Declaration Ecore International | Rubber Flooring ………………………………………………………………………………………………..………………………………………………………………………………………… 9 © 2025 SCSglobalServices.com 2.11 PRODUCT INSTALLATION Installation of the product is accomplished using hand tools with negligible impacts and waste. For the current assessment, approximately 4% of the product mass is assumed lost as waste during product installation which is assumed landfilled. Impacts associated with the production, transport, waste processing, and disposal of installation wastage are included in this life cycle phase. The impacts associated with packaging disposal are included with the installation phase as per PCR requirements. 2.12 USE CONDITIONS No special conditions of use are noted. 2.13 PRODUCT REFERENCE SERVICE LIFE AND BUILDING ESTIMATED SERVICE LIFE The Reference Service Life (RSL) of the flooring product is based on the manufacturer’s estimated product lifetime and is summarized in Table 13 below. The building Estimated Service Life (ESL) is 75 years, consistent with the PCR. 2.14 RE-USE PHASE The flooring products are not reused at end-of-life. 2.15 DISPOSAL At end-of-life, the products are disposed of in a landfill, per PCR guidance. It is assumed that no components of the product are recycled at end-of-life. 2.16 FURTHER INFORMATION Further information on the product can be found on the manufacturers’ website at https://www.ecoreintl.com/resources/. 3. LCA: Calculation Rules 3.1 FUNCTIONAL UNIT The functional unit used in the study is defined as 1 m2 of floor covering installed for use over a 75‐year period. The corresponding reference flow for each product system is presented in Table 13. For the present assessment, a reference service lifetime (RSL) corresponding to the manufacturer’s estimated lifetime is assumed. The total number of required product lifecycles during the 75-year period over which the product system is modeled is also summarized for the product in Table 13. Table 13. Reference flows and RSL for the rubber flooring products. Product Reference Flow (kg/m2) Reference Service Lifetime (yr) Replacement Cycle Total # of Life Cycles QT/ECOsilence 4.78 60 0.3 1.3 Performance UltraTile /ECOmax 1"- Low color 20.14 20 2.8 3.8 Performance UltraTile /ECOmax 1"- High color 21.15 20 2.8 3.8 Fit Collection/ECOnights - Low color 9.39 15 4.0 5.0 Fit Collection/ECOnights - High color 13.77 15 4.0 5.0 ECOfit Plus/Performance Rally 15.46 15 4.0 5.0 ECOfit/Performance Motivate 10.50 15 4.0 5.0
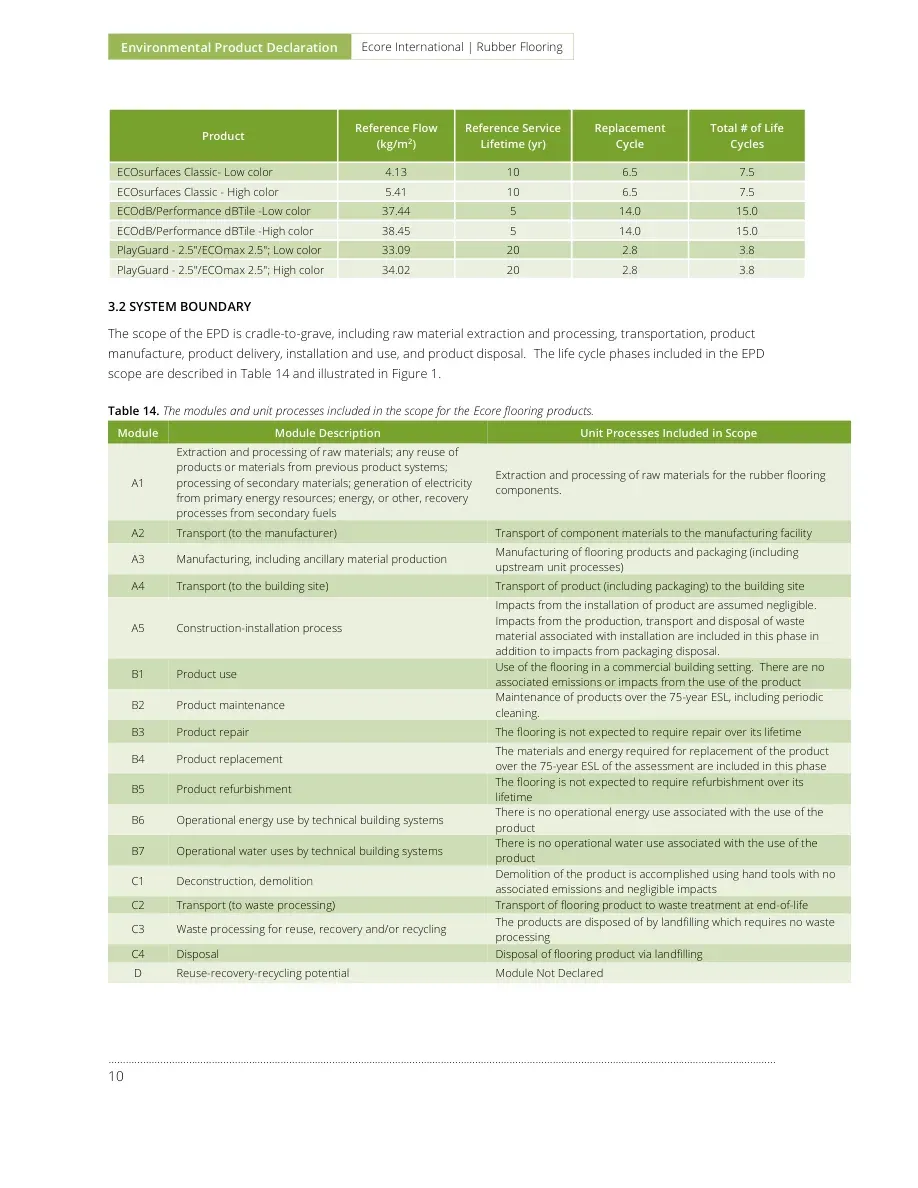
Environmental Product Declaration Ecore International | Rubber Flooring ………………………………………………………………………………………………..…………………………………………………………………………………………………………… 10 Product Reference Flow (kg/m2) Reference Service Lifetime (yr) Replacement Cycle Total # of Life Cycles ECOsurfaces Classic- Low color 4.13 10 6.5 7.5 ECOsurfaces Classic - High color 5.41 10 6.5 7.5 ECOdB/Performance dBTile -Low color 37.44 5 14.0 15.0 ECOdB/Performance dBTile -High color 38.45 5 14.0 15.0 PlayGuard - 2.5"/ECOmax 2.5"; Low color 33.09 20 2.8 3.8 PlayGuard - 2.5"/ECOmax 2.5"; High color 34.02 20 2.8 3.8 3.2 SYSTEM BOUNDARY The scope of the EPD is cradle-to-grave, including raw material extraction and processing, transportation, product manufacture, product delivery, installation and use, and product disposal. The life cycle phases included in the EPD scope are described in Table 14 and illustrated in Figure 1. Table 14. The modules and unit processes included in the scope for the Ecore flooring products. Module Module Description Unit Processes Included in Scope A1 Extraction and processing of raw materials; any reuse of products or materials from previous product systems; processing of secondary materials; generation of electricity from primary energy resources; energy, or other, recovery processes from secondary fuels Extraction and processing of raw materials for the rubber flooring components. A2 Transport (to the manufacturer) Transport of component materials to the manufacturing facility A3 Manufacturing, including ancillary material production Manufacturing of flooring products and packaging (including upstream unit processes) A4 Transport (to the building site) Transport of product (including packaging) to the building site A5 Construction-installation process Impacts from the installation of product are assumed negligible. Impacts from the production, transport and disposal of waste material associated with installation are included in this phase in addition to impacts from packaging disposal. B1 Product use Use of the flooring in a commercial building setting. There are no associated emissions or impacts from the use of the product B2 Product maintenance Maintenance of products over the 75-year ESL, including periodic cleaning. B3 Product repair The flooring is not expected to require repair over its lifetime B4 Product replacement The materials and energy required for replacement of the product over the 75-year ESL of the assessment are included in this phase B5 Product refurbishment The flooring is not expected to require refurbishment over its lifetime B6 Operational energy use by technical building systems There is no operational energy use associated with the use of the product B7 Operational water uses by technical building systems There is no operational water use associated with the use of the product C1 Deconstruction, demolition Demolition of the product is accomplished using hand tools with no associated emissions and negligible impacts C2 Transport (to waste processing) Transport of flooring product to waste treatment at end-of-life C3 Waste processing for reuse, recovery and/or recycling The products are disposed of by landfilling which requires no waste processing C4 Disposal Disposal of flooring product via landfilling D Reuse-recovery-recycling potential Module Not Declared
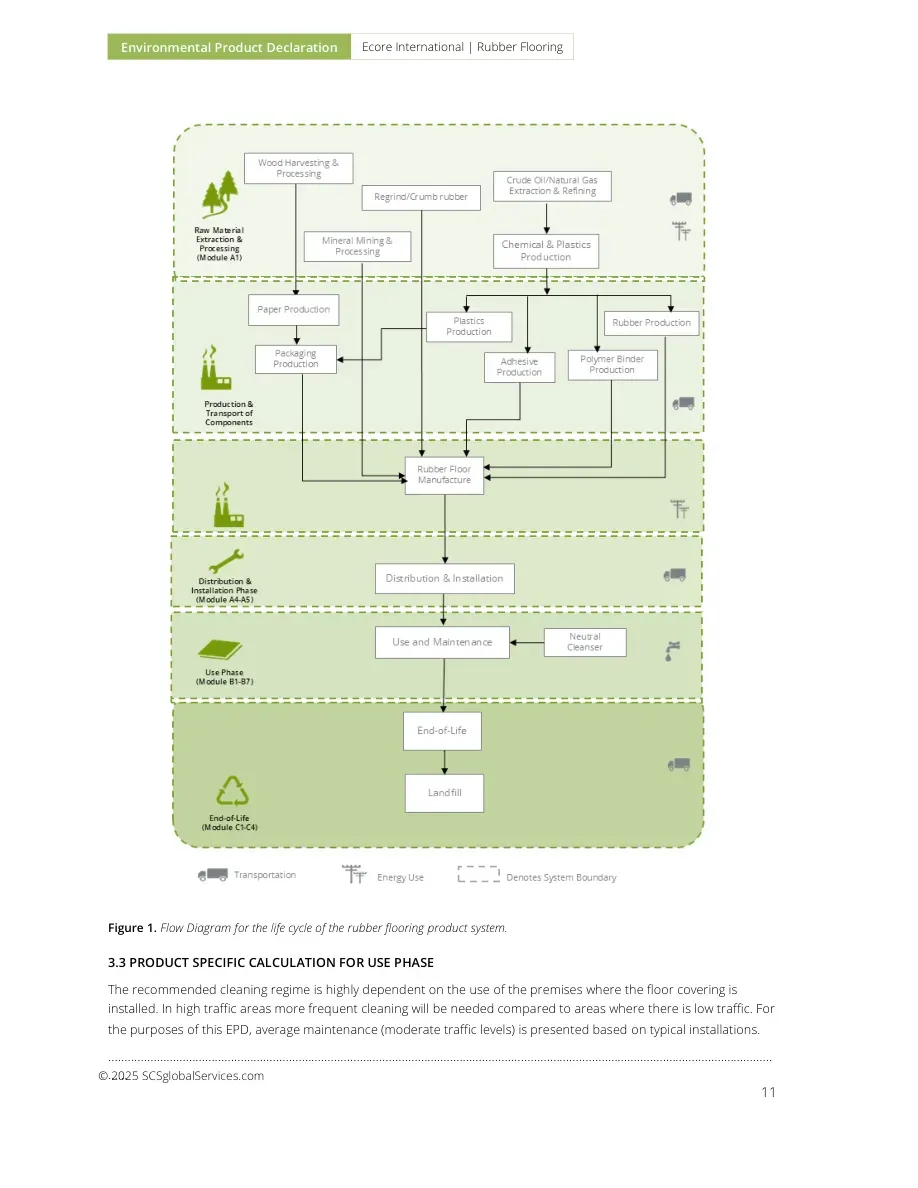
Environmental Product Declaration Ecore International | Rubber Flooring ………………………………………………………………………………………………..………………………………………………………………………………………… 11 © 2025 SCSglobalServices.com Figure 1. Flow Diagram for the life cycle of the rubber flooring product system. 3.3 PRODUCT SPECIFIC CALCULATION FOR USE PHASE The recommended cleaning regime is highly dependent on the use of the premises where the floor covering is installed. In high traffic areas more frequent cleaning will be needed compared to areas where there is low traffic. For the purposes of this EPD, average maintenance (moderate traffic levels) is presented based on typical installations.
Environmental Product Declaration Ecore International | Rubber Flooring ………………………………………………………………………………………………..…………………………………………………………………………………………………………… 12 3.4 UNITS All data and results are presented using SI units. 3.5 ESTIMATES AND ASSUMPTIONS ▪ The Reference Service Life (RSL) of the products was modeled based on information provided by the manufacturer assuming their products are installed and maintained as recommended and used for the specific application noted. ▪ For the product end-of-life, disposal of product packaging is modeled based on the PCR guidance regarding recycling rates of packaging materials. ▪ For final disposal of the packaging material and flooring products at end-of-life, all materials are assumed to be transported 100 miles (161 km) by diesel truck to either a landfill or material reclamation facility (for recycling). Datasets representing disposal in a landfill and waste incineration are from Ecoinvent. ▪ Modeling of recycled materials follows the recycled content method (also known as 100-0 method or cut-off method) whereby only the burdens of reprocessing the waste material are allocated to the system from the use of the recycled material. ▪ Electricity use at the manufacturing facilities was allocated to the Ecore flooring products based on the product area as a fraction of the total production. ▪ The Ecore production facilities are located in the RFCE and SRSO eGRID EPA NERC subregions. An Ecoinvent inventory dataset was modified to reflect the eGRID energy mixes to estimate resource use and emissions from electricity use at the manufacturing facilities. ▪ Downstream transport was modeled based on information provided by the manufacturer representing transport for global product distribution. ▪ The maintenance phase of the product life cycle was modeled based on information provided by the manufacturer including recommended installation and cleaning methods, as well as cleaning frequency. The PCR requires the results for several inventory flows related to construction products to be reported including energy and resource use and waste and outflows. These are aggregated inventory flows, and do not characterize any potential impact; results should be interpreted considering this limitation. 3.6 CUT-OFF RULES According to the PCR, processes contributing greater than 1% of the total environmental impact indicator for each impact are included in the inventory. No data gaps were allowed which were expected to significantly affect the outcome of the indicator results. No known flows are deliberately excluded from this EPD. 3.7 DATA SOURCES Primary data were provided by Ecore for their manufacturing facilities. The sources of secondary LCI data are the Ecoinvent database.
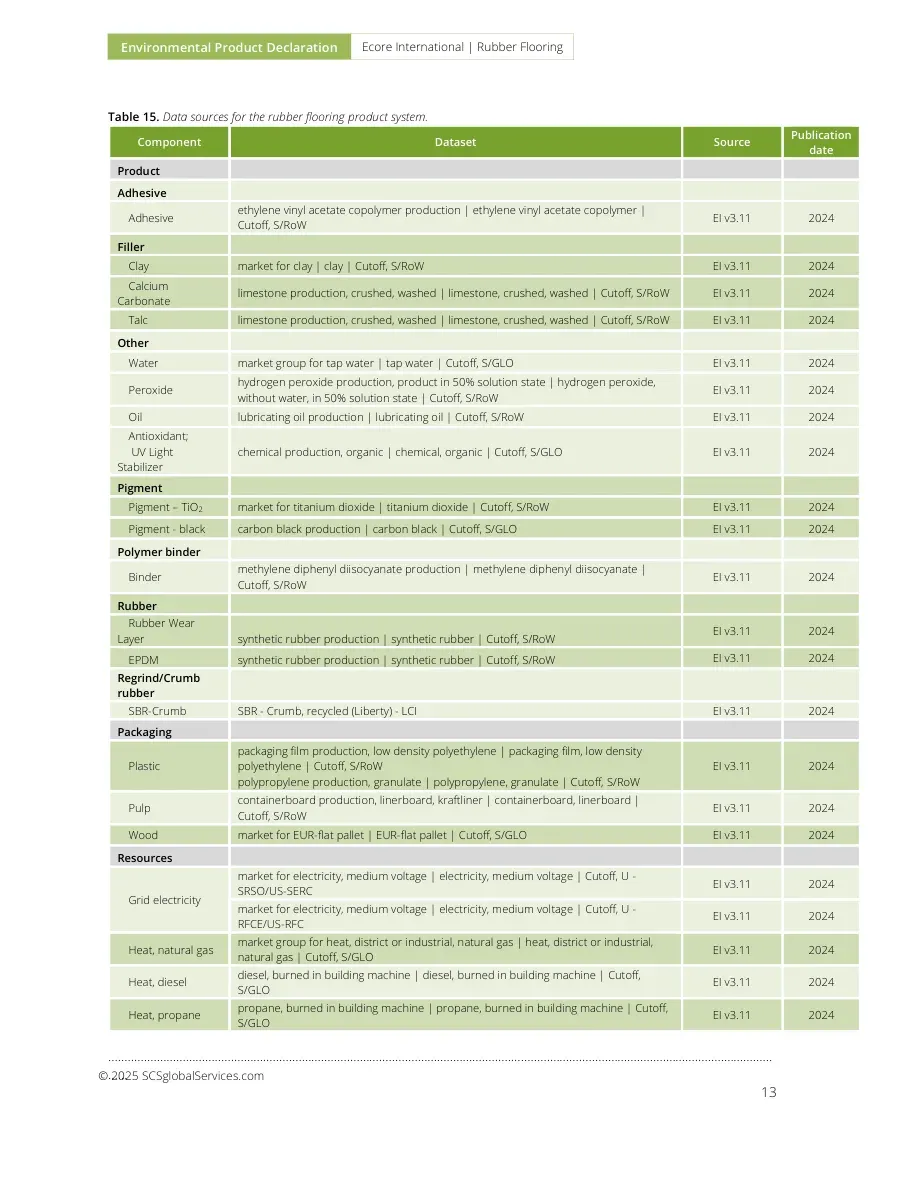
Environmental Product Declaration Ecore International | Rubber Flooring ………………………………………………………………………………………………..………………………………………………………………………………………… 13 © 2025 SCSglobalServices.com Table 15. Data sources for the rubber flooring product system. Component Dataset Source Publication date Product Adhesive Adhesive ethylene vinyl acetate copolymer production | ethylene vinyl acetate copolymer | Cutoff, S/RoW EI v3.11 2024 Filler Clay market for clay | clay | Cutoff, S/RoW EI v3.11 2024 Calcium Carbonate limestone production, crushed, washed | limestone, crushed, washed | Cutoff, S/RoW EI v3.11 2024 Talc limestone production, crushed, washed | limestone, crushed, washed | Cutoff, S/RoW EI v3.11 2024 Other Water market group for tap water | tap water | Cutoff, S/GLO EI v3.11 2024 Peroxide hydrogen peroxide production, product in 50% solution state | hydrogen peroxide, without water, in 50% solution state | Cutoff, S/RoW EI v3.11 2024 Oil lubricating oil production | lubricating oil | Cutoff, S/RoW EI v3.11 2024 Antioxidant; UV Light Stabilizer chemical production, organic | chemical, organic | Cutoff, S/GLO EI v3.11 2024 Pigment Pigment – TiO2 market for titanium dioxide | titanium dioxide | Cutoff, S/RoW EI v3.11 2024 Pigment - black carbon black production | carbon black | Cutoff, S/GLO EI v3.11 2024 Polymer binder Binder methylene diphenyl diisocyanate production | methylene diphenyl diisocyanate | Cutoff, S/RoW EI v3.11 2024 Rubber Rubber Wear Layer synthetic rubber production | synthetic rubber | Cutoff, S/RoW EI v3.11 2024 EPDM synthetic rubber production | synthetic rubber | Cutoff, S/RoW EI v3.11 2024 Regrind/Crumb rubber SBR-Crumb SBR - Crumb, recycled (Liberty) - LCI EI v3.11 2024 Packaging Plastic packaging film production, low density polyethylene | packaging film, low density polyethylene | Cutoff, S/RoW polypropylene production, granulate | polypropylene, granulate | Cutoff, S/RoW EI v3.11 2024 Pulp containerboard production, linerboard, kraftliner | containerboard, linerboard | Cutoff, S/RoW EI v3.11 2024 Wood market for EUR-flat pallet | EUR-flat pallet | Cutoff, S/GLO EI v3.11 2024 Resources Grid electricity market for electricity, medium voltage | electricity, medium voltage | Cutoff, U - SRSO/US-SERC EI v3.11 2024 market for electricity, medium voltage | electricity, medium voltage | Cutoff, U - RFCE/US-RFC EI v3.11 2024 Heat, natural gas market group for heat, district or industrial, natural gas | heat, district or industrial, natural gas | Cutoff, S/GLO EI v3.11 2024 Heat, diesel diesel, burned in building machine | diesel, burned in building machine | Cutoff, S/GLO EI v3.11 2024 Heat, propane propane, burned in building machine | propane, burned in building machine | Cutoff, S/GLO EI v3.11 2024
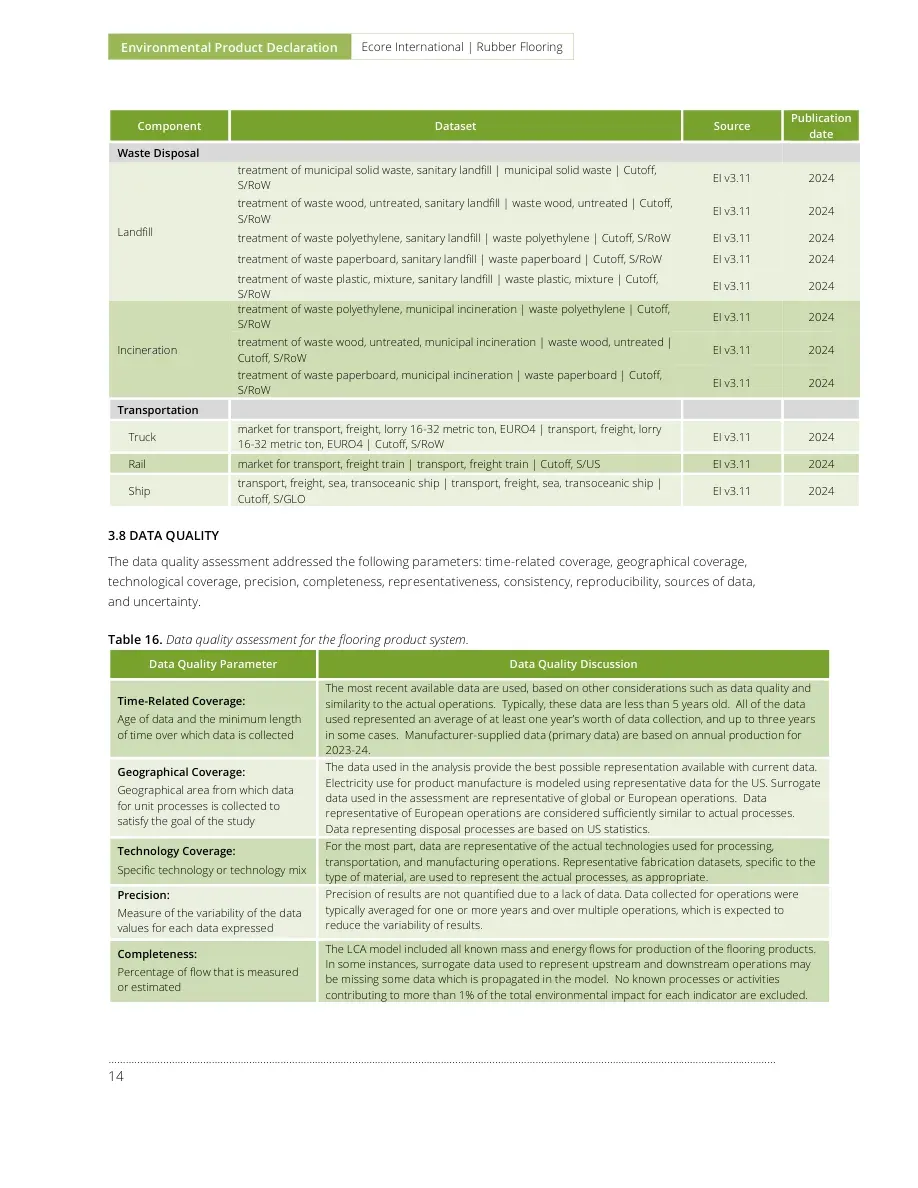
Environmental Product Declaration Ecore International | Rubber Flooring ………………………………………………………………………………………………..…………………………………………………………………………………………………………… 14 Component Dataset Source Publication date Waste Disposal Landfill treatment of municipal solid waste, sanitary landfill | municipal solid waste | Cutoff, S/RoW EI v3.11 2024 treatment of waste wood, untreated, sanitary landfill | waste wood, untreated | Cutoff, S/RoW EI v3.11 2024 treatment of waste polyethylene, sanitary landfill | waste polyethylene | Cutoff, S/RoW EI v3.11 2024 treatment of waste paperboard, sanitary landfill | waste paperboard | Cutoff, S/RoW EI v3.11 2024 treatment of waste plastic, mixture, sanitary landfill | waste plastic, mixture | Cutoff, S/RoW EI v3.11 2024 Incineration treatment of waste polyethylene, municipal incineration | waste polyethylene | Cutoff, S/RoW EI v3.11 2024 treatment of waste wood, untreated, municipal incineration | waste wood, untreated | Cutoff, S/RoW EI v3.11 2024 treatment of waste paperboard, municipal incineration | waste paperboard | Cutoff, S/RoW EI v3.11 2024 Transportation Truck market for transport, freight, lorry 16-32 metric ton, EURO4 | transport, freight, lorry 16-32 metric ton, EURO4 | Cutoff, S/RoW EI v3.11 2024 Rail market for transport, freight train | transport, freight train | Cutoff, S/US EI v3.11 2024 Ship transport, freight, sea, transoceanic ship | transport, freight, sea, transoceanic ship | Cutoff, S/GLO EI v3.11 2024 3.8 DATA QUALITY The data quality assessment addressed the following parameters: time-related coverage, geographical coverage, technological coverage, precision, completeness, representativeness, consistency, reproducibility, sources of data, and uncertainty. Table 16. Data quality assessment for the flooring product system. Data Quality Parameter Data Quality Discussion Time-Related Coverage: Age of data and the minimum length of time over which data is collected The most recent available data are used, based on other considerations such as data quality and similarity to the actual operations. Typically, these data are less than 5 years old. All of the data used represented an average of at least one year’s worth of data collection, and up to three years in some cases. Manufacturer-supplied data (primary data) are based on annual production for 2023-24. Geographical Coverage: Geographical area from which data for unit processes is collected to satisfy the goal of the study The data used in the analysis provide the best possible representation available with current data. Electricity use for product manufacture is modeled using representative data for the US. Surrogate data used in the assessment are representative of global or European operations. Data representative of European operations are considered sufficiently similar to actual processes. Data representing disposal processes are based on US statistics. Technology Coverage: Specific technology or technology mix For the most part, data are representative of the actual technologies used for processing, transportation, and manufacturing operations. Representative fabrication datasets, specific to the type of material, are used to represent the actual processes, as appropriate. Precision: Measure of the variability of the data values for each data expressed Precision of results are not quantified due to a lack of data. Data collected for operations were typically averaged for one or more years and over multiple operations, which is expected to reduce the variability of results. Completeness: Percentage of flow that is measured or estimated The LCA model included all known mass and energy flows for production of the flooring products. In some instances, surrogate data used to represent upstream and downstream operations may be missing some data which is propagated in the model. No known processes or activities contributing to more than 1% of the total environmental impact for each indicator are excluded.

Environmental Product Declaration Ecore International | Rubber Flooring ………………………………………………………………………………………………..………………………………………………………………………………………… 15 © 2025 SCSglobalServices.com Data Quality Parameter Data Quality Discussion Representativeness: Qualitative assessment of the degree to which the data set reflects the true population of interest Data used in the assessment represent typical or average processes as currently reported from multiple data sources and are therefore generally representative of the range of actual processes and technologies for production of these materials. Considerable deviation may exist among actual processes on a site-specific basis; however, such a determination would require detailed data collection throughout the supply chain back to resource extraction. Consistency: Qualitative assessment of whether the study methodology is applied uniformly to the various components of the analysis The consistency of the assessment is considered to be high. Data sources of similar quality and age are used; with a bias towards the most recent data where available. Different portions of the product life cycle are equally considered; however, it must be noted that final disposition of the product is based on assumptions of current average practices in the United States. Reproducibility: Qualitative assessment of the extent to which information about the methodology and data values would allow an independent practitioner to reproduce the results reported in the study Based on the description of data and assumptions used, this assessment would be reproducible by other practitioners. All assumptions, models, and data sources are documented. Sources of the Data: Description of all primary and secondary data sources Data representing energy use at Ecore’s manufacturing facilities represents an annual average and are considered of high quality due to the length of time over which these data are collected, as compared to a snapshot that may not accurately reflect fluctuations in production. For secondary LCI data, Ecoinvent v3.11 LCI data are used. Uncertainty of the Information: Uncertainty related to data, models, and assumptions Uncertainty related to materials in the flooring products and packaging is low. Actual supplier data for upstream operations was not available for all suppliers and the study relied upon the use of existing representative datasets. These datasets contained relatively recent data (<10 years) but lacked geographical representativeness. Uncertainty related to the impact assessment methods used in the study are high. The impact assessment method required by the PCR includes impact potentials, which lack characterization of providing and receiving environments or tipping points. 3.9 PERIOD UNDER REVIEW Manufacturer-supplied data (primary data) are based on annual production for September 2023-August 2024. 3.10 ALLOCATION Resource use at Ecore’s Lancaster and York production facilities (e.g., water and energy) was allocated to the product based on the product area as a fraction of the total facility production volume (i.e., area-based allocation). Area-based allocation was deemed most appropriate for the flooring products as total facility production was available as total square meters of product produced. At the Ozark facility, electricity and resource use was reported for all products manufactured, of which only a small fraction are flooring products, and facility total production mass was provided. Therefore, a mass-based allocation approach is used for the products manufactured at Ozark facility. Based on the location, electricity use at the Ecore manufacturing facilities was modeled using inventory datasets modified to reflect the eGRID energy mix for the applicable eGRID EPA NERC subregion. Impacts from transportation were allocated based on the mass of material and distance transported. 3.11 COMPARABILITY The PCR this EPD was based on was not written to support comparative assertions. EPDs based on different PCRs, or different calculation models, may not be comparable. When attempting to compare EPDs or life cycle impacts of products from different companies, the user should be aware of the uncertainty in the final results, due to and not limited to, the practitioner’s assumptions, the source of the data used in the study, and the specifics of the product modeled.
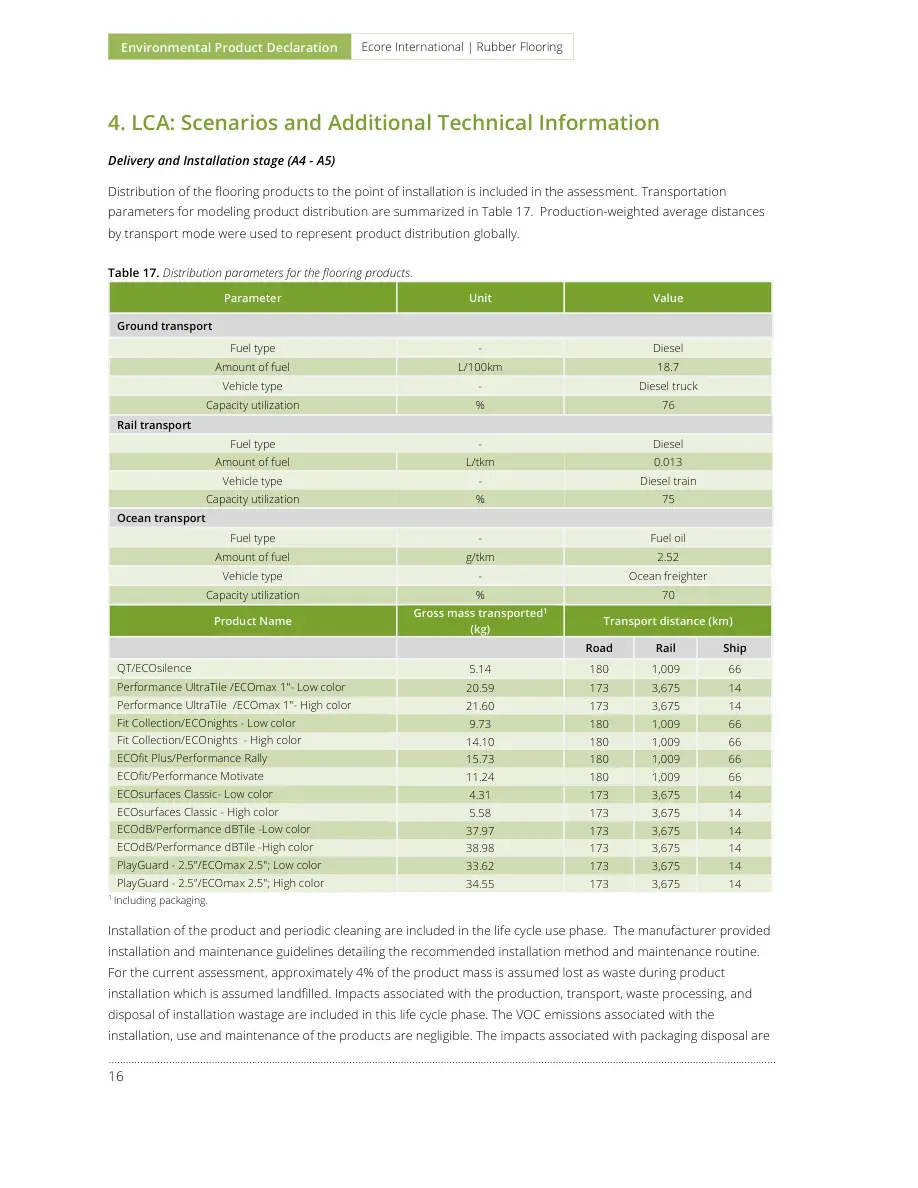
Environmental Product Declaration Ecore International | Rubber Flooring ………………………………………………………………………………………………..…………………………………………………………………………………………………………… 16 4. LCA: Scenarios and Additional Technical Information Delivery and Installation stage (A4 - A5) Distribution of the flooring products to the point of installation is included in the assessment. Transportation parameters for modeling product distribution are summarized in Table 17. Production-weighted average distances by transport mode were used to represent product distribution globally. Table 17. Distribution parameters for the flooring products. Parameter Unit Value Ground transport Fuel type - Diesel Amount of fuel L/100km 18.7 Vehicle type - Diesel truck Capacity utilization % 76 Rail transport Fuel type - Diesel Amount of fuel L/tkm 0.013 Vehicle type - Diesel train Capacity utilization % 75 Ocean transport Fuel type - Fuel oil Amount of fuel g/tkm 2.52 Vehicle type - Ocean freighter Capacity utilization % 70 Product Name Gross mass transported1 (kg) Transport distance (km) Road Rail Ship QT/ECOsilence 5.14 180 1,009 66 Performance UltraTile /ECOmax 1"- Low color 20.59 173 3,675 14 Performance UltraTile /ECOmax 1"- High color 21.60 173 3,675 14 Fit Collection/ECOnights - Low color 9.73 180 1,009 66 Fit Collection/ECOnights - High color 14.10 180 1,009 66 ECOfit Plus/Performance Rally 15.73 180 1,009 66 ECOfit/Performance Motivate 11.24 180 1,009 66 ECOsurfaces Classic- Low color 4.31 173 3,675 14 ECOsurfaces Classic - High color 5.58 173 3,675 14 ECOdB/Performance dBTile -Low color 37.97 173 3,675 14 ECOdB/Performance dBTile -High color 38.98 173 3,675 14 PlayGuard - 2.5"/ECOmax 2.5"; Low color 33.62 173 3,675 14 PlayGuard - 2.5"/ECOmax 2.5"; High color 34.55 173 3,675 14 1 Including packaging. Installation of the product and periodic cleaning are included in the life cycle use phase. The manufacturer provided installation and maintenance guidelines detailing the recommended installation method and maintenance routine. For the current assessment, approximately 4% of the product mass is assumed lost as waste during product installation which is assumed landfilled. Impacts associated with the production, transport, waste processing, and disposal of installation wastage are included in this life cycle phase. The VOC emissions associated with the installation, use and maintenance of the products are negligible. The impacts associated with packaging disposal are
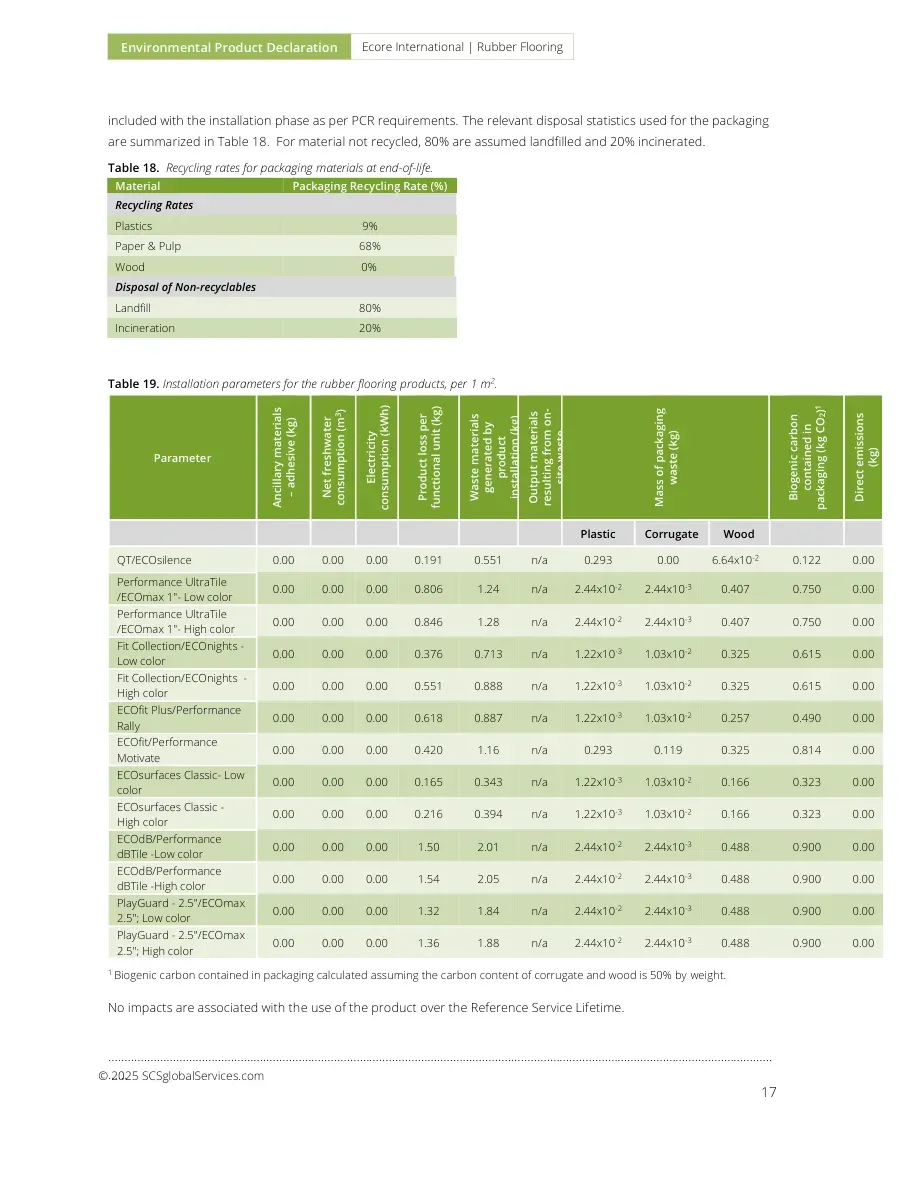
Environmental Product Declaration Ecore International | Rubber Flooring ………………………………………………………………………………………………..………………………………………………………………………………………… 17 © 2025 SCSglobalServices.com included with the installation phase as per PCR requirements. The relevant disposal statistics used for the packaging are summarized in Table 18. For material not recycled, 80% are assumed landfilled and 20% incinerated. Table 18. Recycling rates for packaging materials at end-of-life. Material Packaging Recycling Rate (%) Recycling Rates Plastics 9% Paper & Pulp 68% Wood 0% Disposal of Non-recyclables Landfill 80% Incineration 20% Table 19. Installation parameters for the rubber flooring products, per 1 m2. Parameter Ancillary materials – adhesive (kg) Net freshwater consumption (m3) Electricity consumption (kWh) Product loss per functional unit (kg) Waste materials generated by product installation (kg)Output materials resulting from on-site wasteMass of packaging waste (kg) Biogenic carbon contained in packaging (kg CO2)1 Direct emissions (kg) Plastic Corrugate Wood QT/ECOsilence 0.00 0.00 0.00 0.191 0.551 n/a 0.293 0.00 6.64x10⁻² 0.122 0.00 Performance UltraTile /ECOmax 1"- Low color 0.00 0.00 0.00 0.806 1.24 n/a 2.44x10⁻² 2.44x10⁻³ 0.407 0.750 0.00 Performance UltraTile /ECOmax 1"- High color 0.00 0.00 0.00 0.846 1.28 n/a 2.44x10⁻² 2.44x10⁻³ 0.407 0.750 0.00 Fit Collection/ECOnights - Low color 0.00 0.00 0.00 0.376 0.713 n/a 1.22x10⁻³ 1.03x10⁻² 0.325 0.615 0.00 Fit Collection/ECOnights - High color 0.00 0.00 0.00 0.551 0.888 n/a 1.22x10⁻³ 1.03x10⁻² 0.325 0.615 0.00 ECOfit Plus/Performance Rally 0.00 0.00 0.00 0.618 0.887 n/a 1.22x10⁻³ 1.03x10⁻² 0.257 0.490 0.00 ECOfit/Performance Motivate 0.00 0.00 0.00 0.420 1.16 n/a 0.293 0.119 0.325 0.814 0.00 ECOsurfaces Classic- Low color 0.00 0.00 0.00 0.165 0.343 n/a 1.22x10⁻³ 1.03x10⁻² 0.166 0.323 0.00 ECOsurfaces Classic - High color 0.00 0.00 0.00 0.216 0.394 n/a 1.22x10⁻³ 1.03x10⁻² 0.166 0.323 0.00 ECOdB/Performance dBTile -Low color 0.00 0.00 0.00 1.50 2.01 n/a 2.44x10⁻² 2.44x10⁻³ 0.488 0.900 0.00 ECOdB/Performance dBTile -High color 0.00 0.00 0.00 1.54 2.05 n/a 2.44x10⁻² 2.44x10⁻³ 0.488 0.900 0.00 PlayGuard - 2.5"/ECOmax 2.5"; Low color 0.00 0.00 0.00 1.32 1.84 n/a 2.44x10⁻² 2.44x10⁻³ 0.488 0.900 0.00 PlayGuard - 2.5"/ECOmax 2.5"; High color 0.00 0.00 0.00 1.36 1.88 n/a 2.44x10⁻² 2.44x10⁻³ 0.488 0.900 0.00 1 Biogenic carbon contained in packaging calculated assuming the carbon content of corrugate and wood is 50% by weight. No impacts are associated with the use of the product over the Reference Service Lifetime.
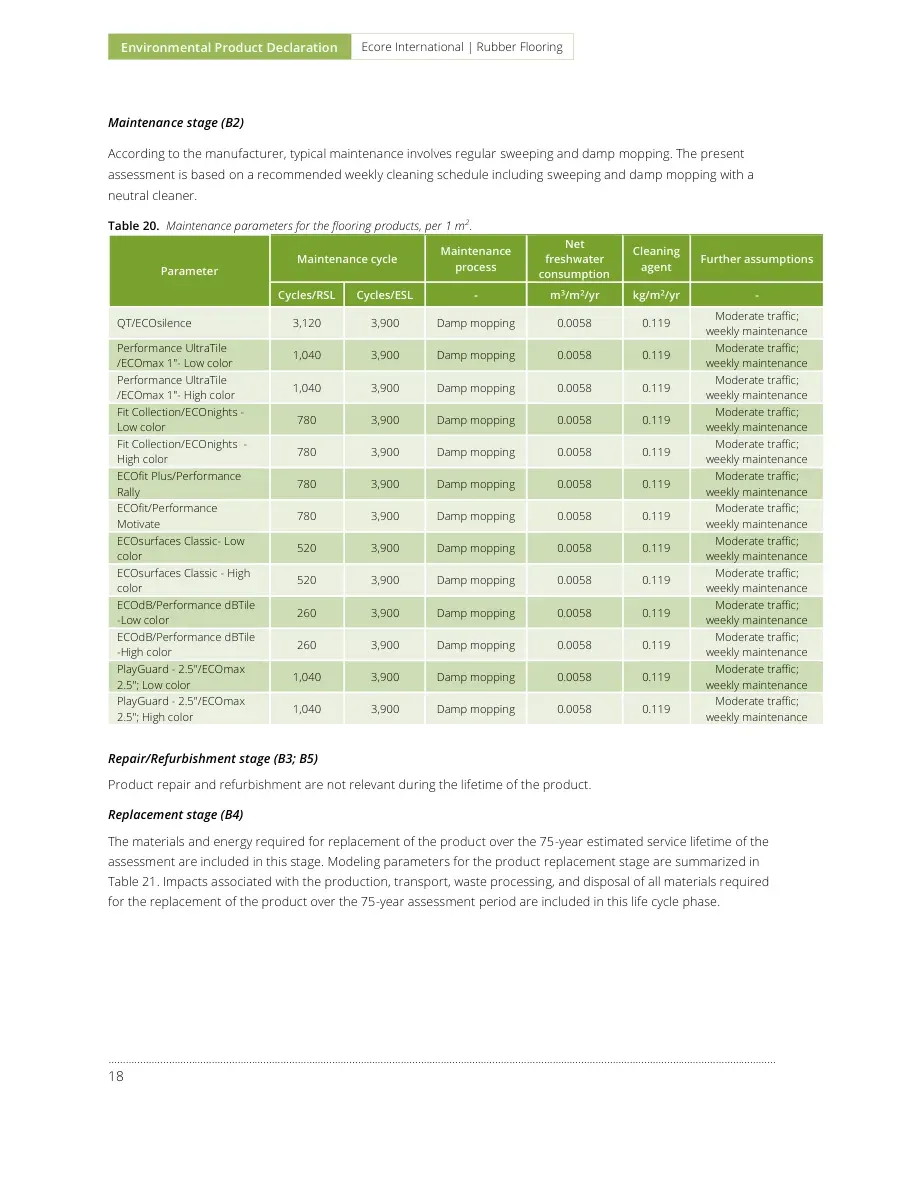
Environmental Product Declaration Ecore International | Rubber Flooring ………………………………………………………………………………………………..…………………………………………………………………………………………………………… 18 Maintenance stage (B2) According to the manufacturer, typical maintenance involves regular sweeping and damp mopping. The present assessment is based on a recommended weekly cleaning schedule including sweeping and damp mopping with a neutral cleaner. Table 20. Maintenance parameters for the flooring products, per 1 m2. Parameter Maintenance cycle Maintenance process Net freshwater consumption Cleaning agent Further assumptions Cycles/RSL Cycles/ESL - m3/m2/yr kg/m2/yr - QT/ECOsilence 3,120 3,900 Damp mopping 0.0058 0.119 Moderate traffic; weekly maintenance Performance UltraTile /ECOmax 1"- Low color 1,040 3,900 Damp mopping 0.0058 0.119 Moderate traffic; weekly maintenance Performance UltraTile /ECOmax 1"- High color 1,040 3,900 Damp mopping 0.0058 0.119 Moderate traffic; weekly maintenance Fit Collection/ECOnights - Low color 780 3,900 Damp mopping 0.0058 0.119 Moderate traffic; weekly maintenance Fit Collection/ECOnights - High color 780 3,900 Damp mopping 0.0058 0.119 Moderate traffic; weekly maintenance ECOfit Plus/Performance Rally 780 3,900 Damp mopping 0.0058 0.119 Moderate traffic; weekly maintenance ECOfit/Performance Motivate 780 3,900 Damp mopping 0.0058 0.119 Moderate traffic; weekly maintenance ECOsurfaces Classic- Low color 520 3,900 Damp mopping 0.0058 0.119 Moderate traffic; weekly maintenance ECOsurfaces Classic - High color 520 3,900 Damp mopping 0.0058 0.119 Moderate traffic; weekly maintenance ECOdB/Performance dBTile -Low color 260 3,900 Damp mopping 0.0058 0.119 Moderate traffic; weekly maintenance ECOdB/Performance dBTile -High color 260 3,900 Damp mopping 0.0058 0.119 Moderate traffic; weekly maintenance PlayGuard - 2.5"/ECOmax 2.5"; Low color 1,040 3,900 Damp mopping 0.0058 0.119 Moderate traffic; weekly maintenance PlayGuard - 2.5"/ECOmax 2.5"; High color 1,040 3,900 Damp mopping 0.0058 0.119 Moderate traffic; weekly maintenance Repair/Refurbishment stage (B3; B5) Product repair and refurbishment are not relevant during the lifetime of the product. Replacement stage (B4) The materials and energy required for replacement of the product over the 75-year estimated service lifetime of the assessment are included in this stage. Modeling parameters for the product replacement stage are summarized in Table 21. Impacts associated with the production, transport, waste processing, and disposal of all materials required for the replacement of the product over the 75-year assessment period are included in this life cycle phase.
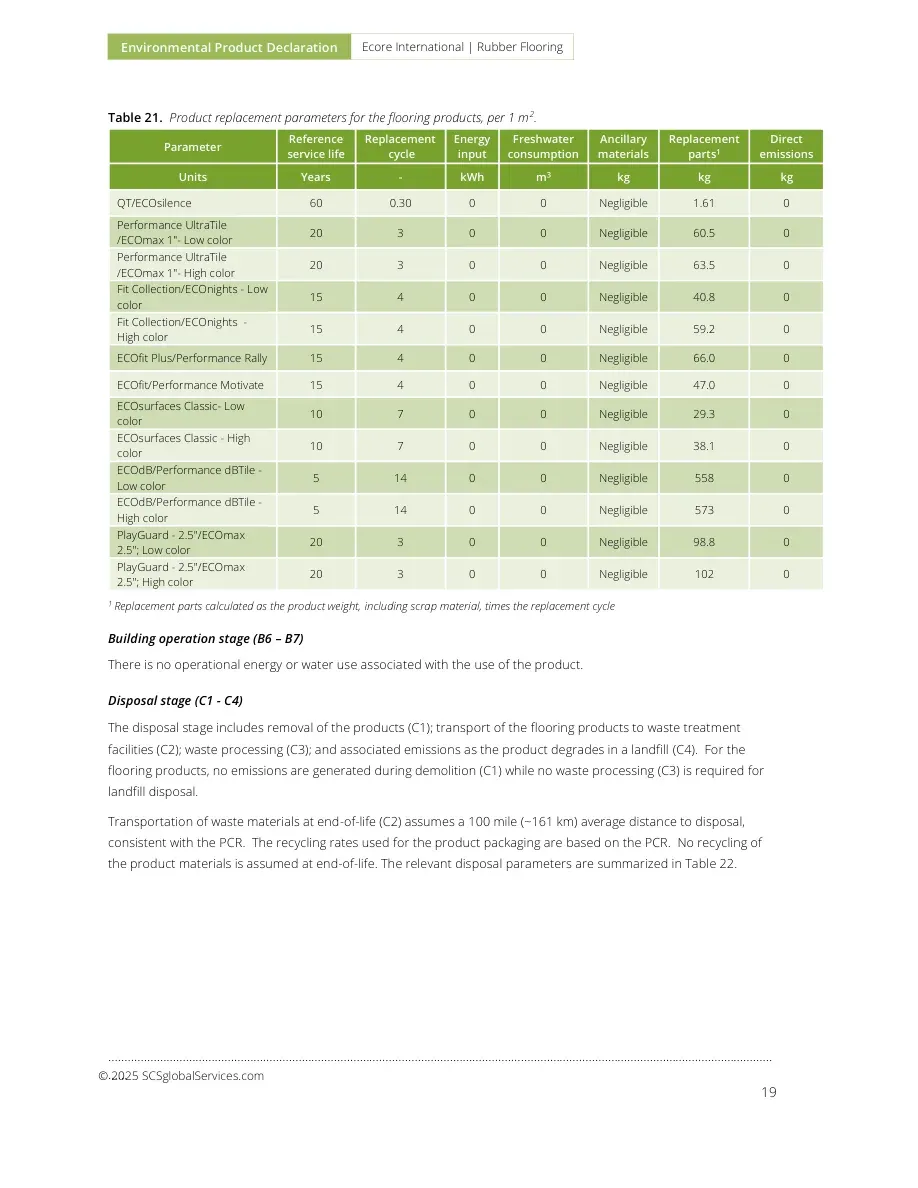
Environmental Product Declaration Ecore International | Rubber Flooring ………………………………………………………………………………………………..………………………………………………………………………………………… 19 © 2025 SCSglobalServices.com Table 21. Product replacement parameters for the flooring products, per 1 m2. Parameter Reference service life Replacement cycle Energy input Freshwater consumption Ancillary materials Replacement parts1 Direct emissions Units Years - kWh m3 kg kg kg QT/ECOsilence 60 0.30 0 0 Negligible 1.61 0 Performance UltraTile /ECOmax 1"- Low color 20 3 0 0 Negligible 60.5 0 Performance UltraTile /ECOmax 1"- High color 20 3 0 0 Negligible 63.5 0 Fit Collection/ECOnights - Low color 15 4 0 0 Negligible 40.8 0 Fit Collection/ECOnights - High color 15 4 0 0 Negligible 59.2 0 ECOfit Plus/Performance Rally 15 4 0 0 Negligible 66.0 0 ECOfit/Performance Motivate 15 4 0 0 Negligible 47.0 0 ECOsurfaces Classic- Low color 10 7 0 0 Negligible 29.3 0 ECOsurfaces Classic - High color 10 7 0 0 Negligible 38.1 0 ECOdB/Performance dBTile -Low color 5 14 0 0 Negligible 558 0 ECOdB/Performance dBTile -High color 5 14 0 0 Negligible 573 0 PlayGuard - 2.5"/ECOmax 2.5"; Low color 20 3 0 0 Negligible 98.8 0 PlayGuard - 2.5"/ECOmax 2.5"; High color 20 3 0 0 Negligible 102 0 1 Replacement parts calculated as the product weight, including scrap material, times the replacement cycle Building operation stage (B6 – B7) There is no operational energy or water use associated with the use of the product. Disposal stage (C1 - C4) The disposal stage includes removal of the products (C1); transport of the flooring products to waste treatment facilities (C2); waste processing (C3); and associated emissions as the product degrades in a landfill (C4). For the flooring products, no emissions are generated during demolition (C1) while no waste processing (C3) is required for landfill disposal. Transportation of waste materials at end-of-life (C2) assumes a 100 mile (~161 km) average distance to disposal, consistent with the PCR. The recycling rates used for the product packaging are based on the PCR. No recycling of the product materials is assumed at end-of-life. The relevant disposal parameters are summarized in Table 22.
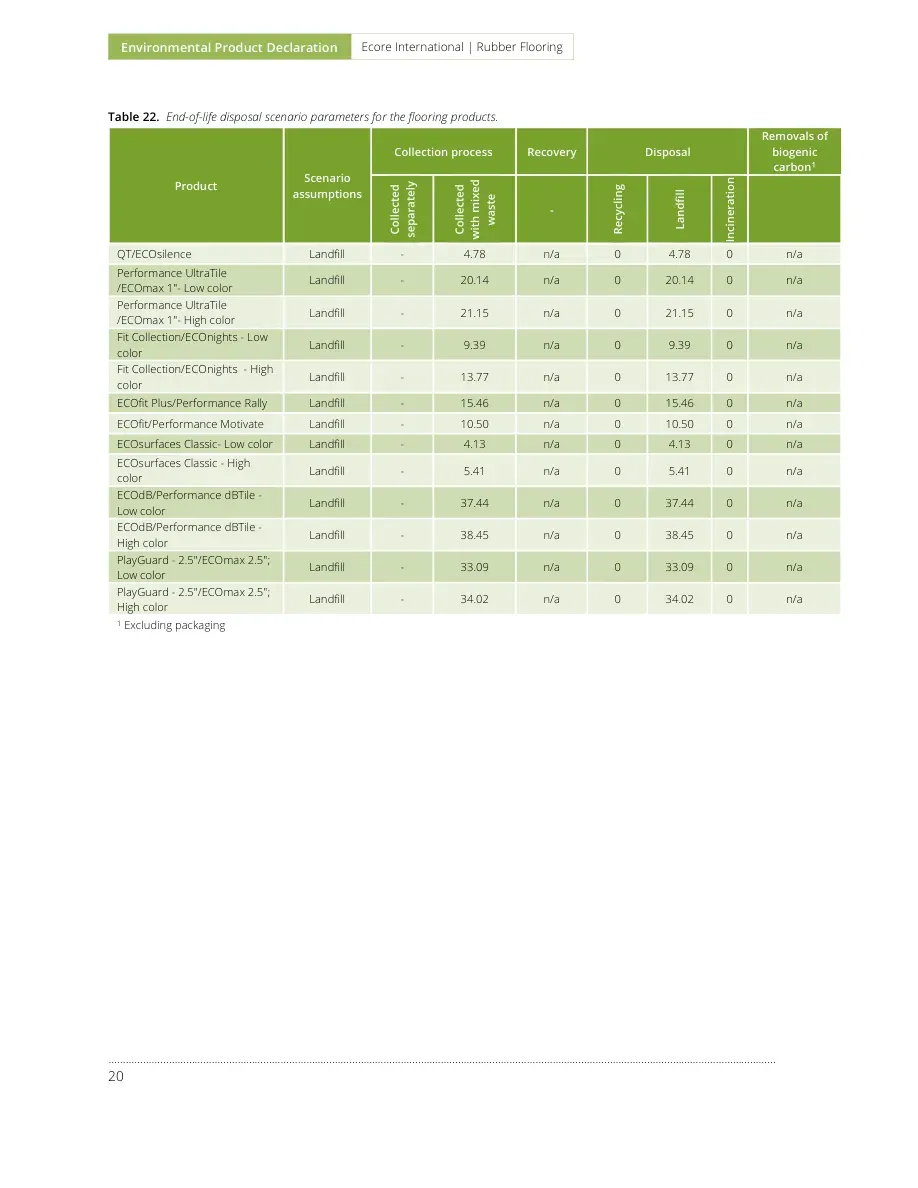
Environmental Product Declaration Ecore International | Rubber Flooring ………………………………………………………………………………………………..…………………………………………………………………………………………………………… 20 Table 22. End-of-life disposal scenario parameters for the flooring products. Product Scenario assumptions Collection process Recovery Disposal Removals of biogenic carbon1 Collected separately Collected with mixed waste - Recycling Landfill Incineration QT/ECOsilence Landfill - 4.78 n/a 0 4.78 0 n/a Performance UltraTile /ECOmax 1"- Low color Landfill - 20.14 n/a 0 20.14 0 n/a Performance UltraTile /ECOmax 1"- High color Landfill - 21.15 n/a 0 21.15 0 n/a Fit Collection/ECOnights - Low color Landfill - 9.39 n/a 0 9.39 0 n/a Fit Collection/ECOnights - High color Landfill - 13.77 n/a 0 13.77 0 n/a ECOfit Plus/Performance Rally Landfill - 15.46 n/a 0 15.46 0 n/a ECOfit/Performance Motivate Landfill - 10.50 n/a 0 10.50 0 n/a ECOsurfaces Classic- Low color Landfill - 4.13 n/a 0 4.13 0 n/a ECOsurfaces Classic - High color Landfill - 5.41 n/a 0 5.41 0 n/a ECOdB/Performance dBTile -Low color Landfill - 37.44 n/a 0 37.44 0 n/a ECOdB/Performance dBTile -High color Landfill - 38.45 n/a 0 38.45 0 n/a PlayGuard - 2.5"/ECOmax 2.5"; Low color Landfill - 33.09 n/a 0 33.09 0 n/a PlayGuard - 2.5"/ECOmax 2.5"; High color Landfill - 34.02 n/a 0 34.02 0 n/a 1 Excluding packaging
Environmental Product Declaration Ecore International | Rubber Flooring ………………………………………………………………………………………………..………………………………………………………………………………………… 21 © 2025 SCSglobalServices.com 5. LCA: Results Results of the Life Cycle Assessment are presented below. It is noted that LCA results are relative expressions and do not predict impacts on category endpoints, the exceeding of thresholds, safety margins or risks. All LCA results are stated to three significant figures in agreement with the PCR for this flooring product and therefore the sum of the total values may not exactly equal 100%. The following environmental impact category indicators are reported using characterization factors based on the U.S. EPA’s Tool for the Reduction and Assessment of Chemical and Other Environmental Impacts – TRACI 2.1 and CML-IA. CMLI-A Impact Category Unit TRACI 2.1 Impact Category Unit Global Warming Potential (GWP) kg CO2 eq Global Warming Potential (GWP) kg CO2 eq Depletion potential of the stratospheric ozone layer (ODP) kg CFC 11 eq Ozone Depletion Potential (ODP) kg CFC 11 eq Acidification Potential of soil and water (AP) kg SO2 eq Acidification Potential (AP) kg SO2 eq Eutrophication Potential (EP) kg PO43- eq Eutrophication Potential (EP) kg N eq Photochemical Oxidant Creation Potential (POCP) kg C2H4 eq Smog Formation Potential (SFP) kg O3 eq Abiotic depletion potential for non-fossil resources (ADPE) kg Sb eq Fossil Fuel Depletion Potential (FFD) MJ Surplus, LHV Abiotic depletion potential for fossil resources (ADPE) MJ, LHV - - These impact categories are globally deemed mature enough to be included in Type III environmental declarations. Other categories are being developed and defined and LCA should continue making advances in their development. However, the EPD users shall not use additional measures for comparative purposes. The following inventory parameters, specified by the PCR, are also reported. Resources Unit Waste and Outflows Unit RPRE: Renewable primary resources used as energy carrier (fuel) MJ, LHV HWD: Hazardous waste disposed kg RPRM: Renewable primary resources with energy content used as material MJ, LHV NHWD: Non-hazardous waste disposed kg NRPRE: Non-renewable primary resources used as an energy carrier (fuel) MJ, LHV HLRW: High-level radioactive waste, conditioned, to final repository kg NRPRM: Non-renewable primary resources with energy content used as material MJ, LHV ILLRW: Intermediate- and low-level radioactive waste, conditioned, to final repository kg SM: Secondary materials kg CRU: Components for re-use kg RSF: Renewable secondary fuels MJ, LHV MR: Materials for recycling kg NRSF: Non-renewable secondary fuels MJ, LHV MER: Materials for energy recovery kg RE: Recovered energy MJ, LHV EE: Recovered energy exported from the product system MJ, LHV FW: Use of net freshwater resources m3 - - Modules B1, B3, B5, B6, and B7 are not associated with any impact and are therefore declared as zero. In addition, modules C1 and C3 are likewise not associated with any impact as the floor is manually deconstructed. Additionally, as rubber flooring products do not typically contain bio-based materials, biogenic carbon emissions and removals are not declared. Module D is not declared. In the interest of space and table readability, these modules are not included in the results presented below.
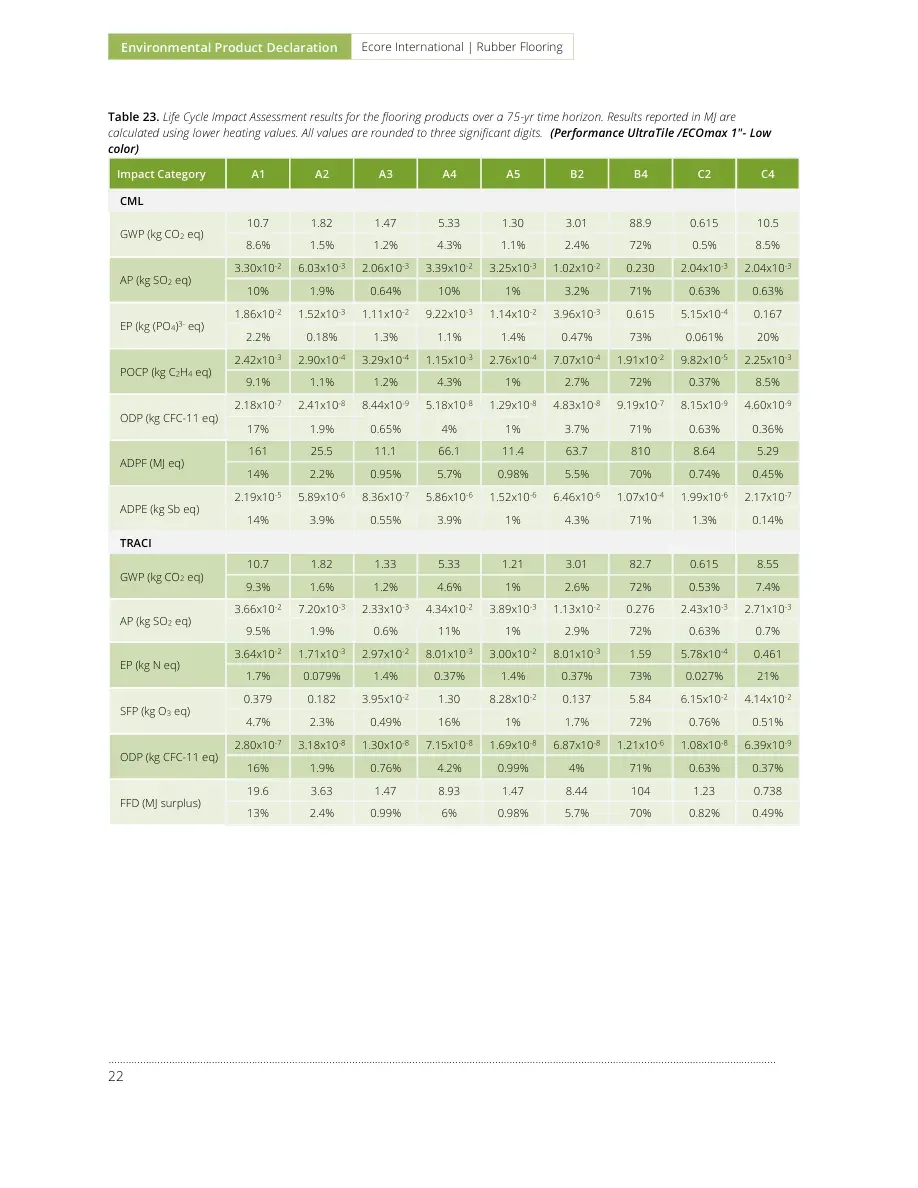
Environmental Product Declaration Ecore International | Rubber Flooring ………………………………………………………………………………………………..…………………………………………………………………………………………………………… 22 Table 23. Life Cycle Impact Assessment results for the flooring products over a 75-yr time horizon. Results reported in MJ are calculated using lower heating values. All values are rounded to three significant digits. (Performance UltraTile /ECOmax 1"- Low color) Impact Category A1 A2 A3 A4 A5 B2 B4 C2 C4 CML GWP (kg CO2 eq) 10.7 1.82 1.47 5.33 1.30 3.01 88.9 0.615 10.5 8.6% 1.5% 1.2% 4.3% 1.1% 2.4% 72% 0.5% 8.5% AP (kg SO2 eq) 3.30x10⁻² 6.03x10⁻³ 2.06x10⁻³ 3.39x10⁻² 3.25x10⁻³ 1.02x10⁻² 0.230 2.04x10⁻³ 2.04x10⁻³ 10% 1.9% 0.64% 10% 1% 3.2% 71% 0.63% 0.63% EP (kg (PO4)3- eq) 1.86x10⁻² 1.52x10⁻³ 1.11x10⁻² 9.22x10⁻³ 1.14x10⁻² 3.96x10⁻³ 0.615 5.15x10⁻⁴ 0.167 2.2% 0.18% 1.3% 1.1% 1.4% 0.47% 73% 0.061% 20% POCP (kg C2H4 eq) 2.42x10⁻³ 2.90x10⁻⁴ 3.29x10⁻⁴ 1.15x10⁻³ 2.76x10⁻⁴ 7.07x10⁻⁴ 1.91x10⁻² 9.82x10⁻⁵ 2.25x10⁻³ 9.1% 1.1% 1.2% 4.3% 1% 2.7% 72% 0.37% 8.5% ODP (kg CFC-11 eq) 2.18x10⁻⁷ 2.41x10⁻⁸ 8.44x10⁻⁹ 5.18x10⁻⁸ 1.29x10⁻⁸ 4.83x10⁻⁸ 9.19x10⁻⁷ 8.15x10⁻⁹ 4.60x10⁻⁹ 17% 1.9% 0.65% 4% 1% 3.7% 71% 0.63% 0.36% ADPF (MJ eq) 161 25.5 11.1 66.1 11.4 63.7 810 8.64 5.29 14% 2.2% 0.95% 5.7% 0.98% 5.5% 70% 0.74% 0.45% ADPE (kg Sb eq) 2.19x10⁻⁵ 5.89x10⁻⁶ 8.36x10⁻⁷ 5.86x10⁻⁶ 1.52x10⁻⁶ 6.46x10⁻⁶ 1.07x10⁻⁴ 1.99x10⁻⁶ 2.17x10⁻⁷ 14% 3.9% 0.55% 3.9% 1% 4.3% 71% 1.3% 0.14% TRACI GWP (kg CO2 eq) 10.7 1.82 1.33 5.33 1.21 3.01 82.7 0.615 8.55 9.3% 1.6% 1.2% 4.6% 1% 2.6% 72% 0.53% 7.4% AP (kg SO2 eq) 3.66x10⁻² 7.20x10⁻³ 2.33x10⁻³ 4.34x10⁻² 3.89x10⁻³ 1.13x10⁻² 0.276 2.43x10⁻³ 2.71x10⁻³ 9.5% 1.9% 0.6% 11% 1% 2.9% 72% 0.63% 0.7% EP (kg N eq) 3.64x10⁻² 1.71x10⁻³ 2.97x10⁻² 8.01x10⁻³ 3.00x10⁻² 8.01x10⁻³ 1.59 5.78x10⁻⁴ 0.461 1.7% 0.079% 1.4% 0.37% 1.4% 0.37% 73% 0.027% 21% SFP (kg O3 eq) 0.379 0.182 3.95x10⁻² 1.30 8.28x10⁻² 0.137 5.84 6.15x10⁻² 4.14x10⁻² 4.7% 2.3% 0.49% 16% 1% 1.7% 72% 0.76% 0.51% ODP (kg CFC-11 eq) 2.80x10⁻⁷ 3.18x10⁻⁸ 1.30x10⁻⁸ 7.15x10⁻⁸ 1.69x10⁻⁸ 6.87x10⁻⁸ 1.21x10⁻⁶ 1.08x10⁻⁸ 6.39x10⁻⁹ 16% 1.9% 0.76% 4.2% 0.99% 4% 71% 0.63% 0.37% FFD (MJ surplus) 19.6 3.63 1.47 8.93 1.47 8.44 104 1.23 0.738 13% 2.4% 0.99% 6% 0.98% 5.7% 70% 0.82% 0.49%
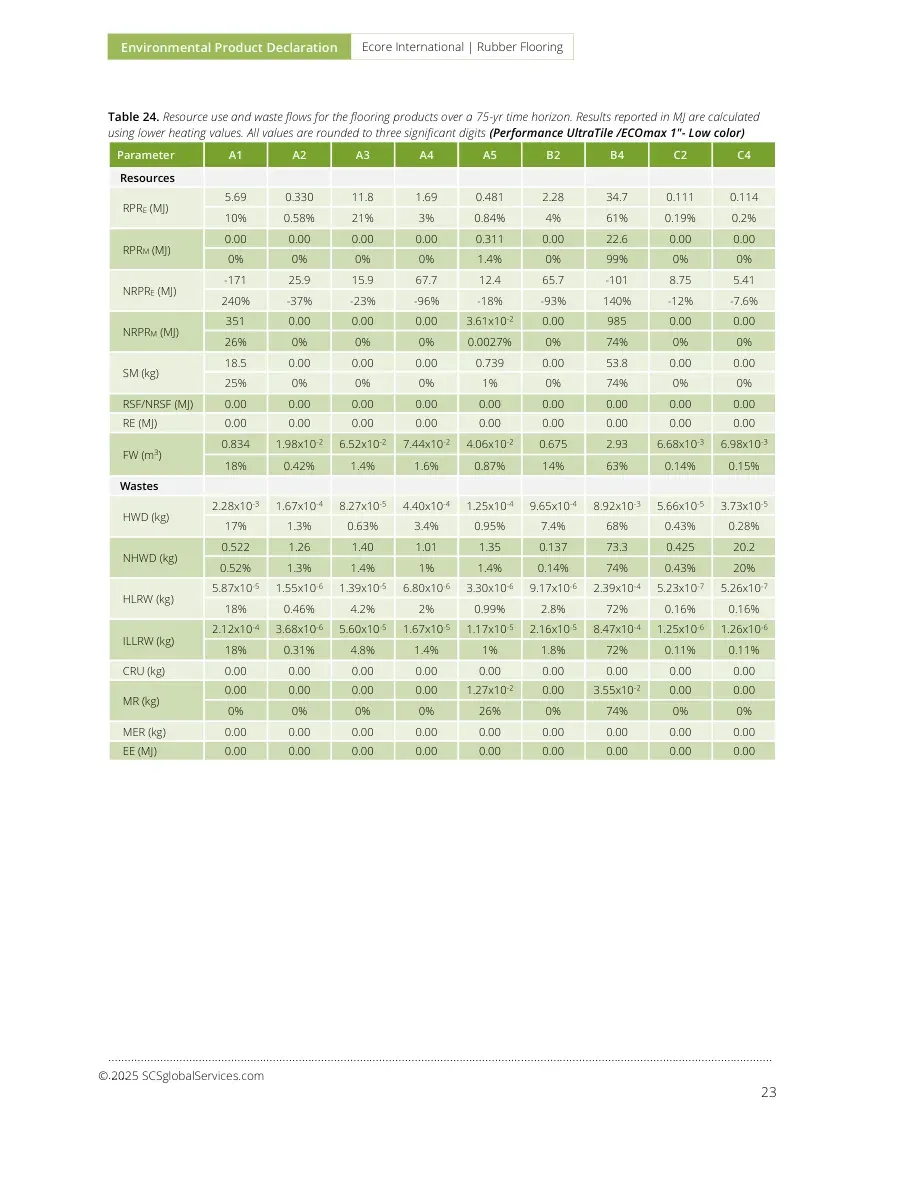
Environmental Product Declaration Ecore International | Rubber Flooring ………………………………………………………………………………………………..………………………………………………………………………………………… 23 © 2025 SCSglobalServices.com Table 24. Resource use and waste flows for the flooring products over a 75-yr time horizon. Results reported in MJ are calculated using lower heating values. All values are rounded to three significant digits (Performance UltraTile /ECOmax 1"- Low color) Parameter A1 A2 A3 A4 A5 B2 B4 C2 C4 Resources RPRE (MJ) 5.69 0.330 11.8 1.69 0.481 2.28 34.7 0.111 0.114 10% 0.58% 21% 3% 0.84% 4% 61% 0.19% 0.2% RPRM (MJ) 0.00 0.00 0.00 0.00 0.311 0.00 22.6 0.00 0.00 0% 0% 0% 0% 1.4% 0% 99% 0% 0% NRPRE (MJ) -171 25.9 15.9 67.7 12.4 65.7 -101 8.75 5.41 240% -37% -23% -96% -18% -93% 140% -12% -7.6% NRPRM (MJ) 351 0.00 0.00 0.00 3.61x10⁻² 0.00 985 0.00 0.00 26% 0% 0% 0% 0.0027% 0% 74% 0% 0% SM (kg) 18.5 0.00 0.00 0.00 0.739 0.00 53.8 0.00 0.00 25% 0% 0% 0% 1% 0% 74% 0% 0% RSF/NRSF (MJ) 0.00 0.00 0.00 0.00 0.00 0.00 0.00 0.00 0.00 RE (MJ) 0.00 0.00 0.00 0.00 0.00 0.00 0.00 0.00 0.00 FW (m3) 0.834 1.98x10⁻² 6.52x10⁻² 7.44x10⁻² 4.06x10⁻² 0.675 2.93 6.68x10⁻³ 6.98x10⁻³ 18% 0.42% 1.4% 1.6% 0.87% 14% 63% 0.14% 0.15% Wastes HWD (kg) 2.28x10⁻³ 1.67x10⁻⁴ 8.27x10⁻⁵ 4.40x10⁻⁴ 1.25x10⁻⁴ 9.65x10⁻⁴ 8.92x10⁻³ 5.66x10⁻⁵ 3.73x10⁻⁵ 17% 1.3% 0.63% 3.4% 0.95% 7.4% 68% 0.43% 0.28% NHWD (kg) 0.522 1.26 1.40 1.01 1.35 0.137 73.3 0.425 20.2 0.52% 1.3% 1.4% 1% 1.4% 0.14% 74% 0.43% 20% HLRW (kg) 5.87x10⁻⁵ 1.55x10⁻⁶ 1.39x10⁻⁵ 6.80x10⁻⁶ 3.30x10⁻⁶ 9.17x10⁻⁶ 2.39x10⁻⁴ 5.23x10⁻⁷ 5.26x10⁻⁷ 18% 0.46% 4.2% 2% 0.99% 2.8% 72% 0.16% 0.16% ILLRW (kg) 2.12x10⁻⁴ 3.68x10⁻⁶ 5.60x10⁻⁵ 1.67x10⁻⁵ 1.17x10⁻⁵ 2.16x10⁻⁵ 8.47x10⁻⁴ 1.25x10⁻⁶ 1.26x10⁻⁶ 18% 0.31% 4.8% 1.4% 1% 1.8% 72% 0.11% 0.11% CRU (kg) 0.00 0.00 0.00 0.00 0.00 0.00 0.00 0.00 0.00 MR (kg) 0.00 0.00 0.00 0.00 1.27x10⁻² 0.00 3.55x10⁻² 0.00 0.00 0% 0% 0% 0% 26% 0% 74% 0% 0% MER (kg) 0.00 0.00 0.00 0.00 0.00 0.00 0.00 0.00 0.00 EE (MJ) 0.00 0.00 0.00 0.00 0.00 0.00 0.00 0.00 0.00
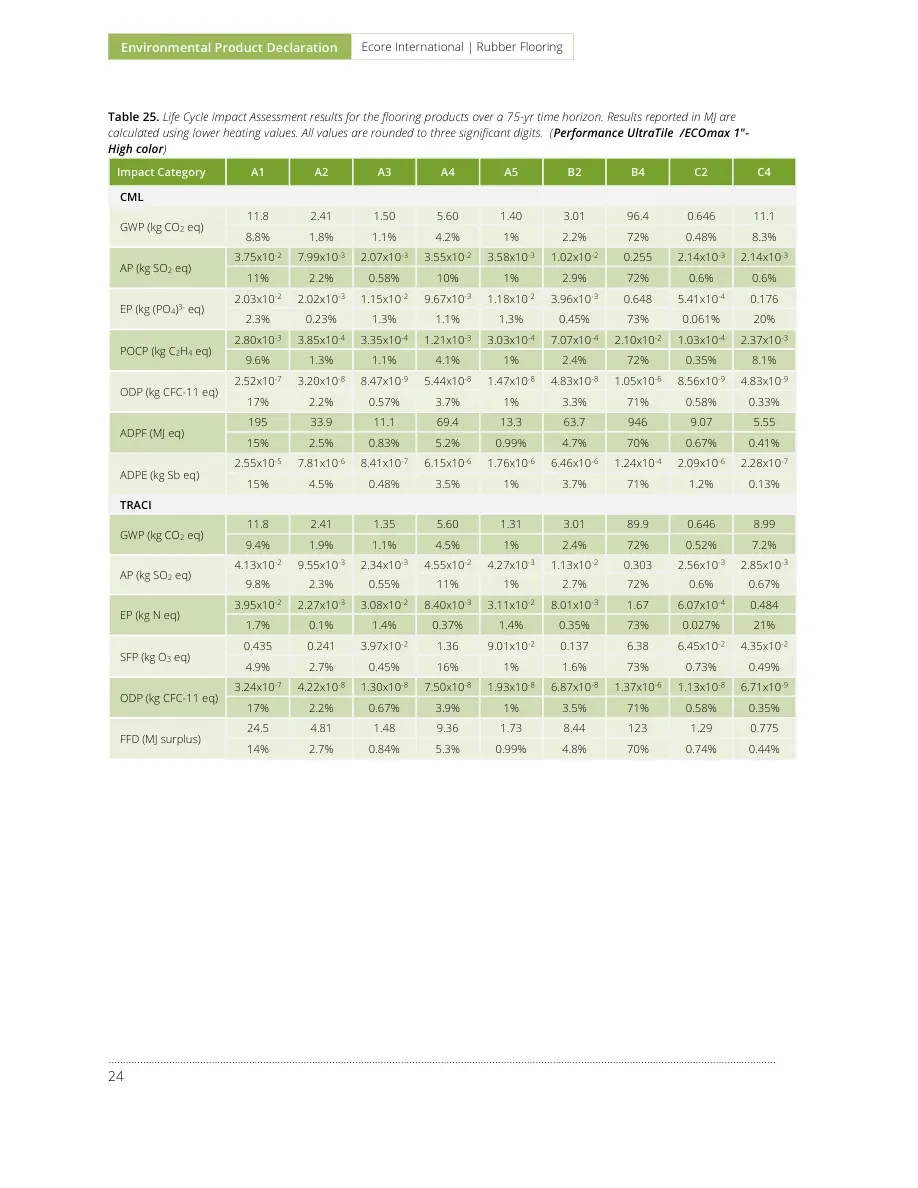
Environmental Product Declaration Ecore International | Rubber Flooring ………………………………………………………………………………………………..…………………………………………………………………………………………………………… 24 Table 25. Life Cycle Impact Assessment results for the flooring products over a 75-yr time horizon. Results reported in MJ are calculated using lower heating values. All values are rounded to three significant digits. (Performance UltraTile /ECOmax 1"- High color) Impact Category A1 A2 A3 A4 A5 B2 B4 C2 C4 CML GWP (kg CO2 eq) 11.8 2.41 1.50 5.60 1.40 3.01 96.4 0.646 11.1 8.8% 1.8% 1.1% 4.2% 1% 2.2% 72% 0.48% 8.3% AP (kg SO2 eq) 3.75x10⁻² 7.99x10⁻³ 2.07x10⁻³ 3.55x10⁻² 3.58x10⁻³ 1.02x10⁻² 0.255 2.14x10⁻³ 2.14x10⁻³ 11% 2.2% 0.58% 10% 1% 2.9% 72% 0.6% 0.6% EP (kg (PO4)3- eq) 2.03x10⁻² 2.02x10⁻³ 1.15x10⁻² 9.67x10⁻³ 1.18x10⁻² 3.96x10⁻³ 0.648 5.41x10⁻⁴ 0.176 2.3% 0.23% 1.3% 1.1% 1.3% 0.45% 73% 0.061% 20% POCP (kg C2H4 eq) 2.80x10⁻³ 3.85x10⁻⁴ 3.35x10⁻⁴ 1.21x10⁻³ 3.03x10⁻⁴ 7.07x10⁻⁴ 2.10x10⁻² 1.03x10⁻⁴ 2.37x10⁻³ 9.6% 1.3% 1.1% 4.1% 1% 2.4% 72% 0.35% 8.1% ODP (kg CFC-11 eq) 2.52x10⁻⁷ 3.20x10⁻⁸ 8.47x10⁻⁹ 5.44x10⁻⁸ 1.47x10⁻⁸ 4.83x10⁻⁸ 1.05x10⁻⁶ 8.56x10⁻⁹ 4.83x10⁻⁹ 17% 2.2% 0.57% 3.7% 1% 3.3% 71% 0.58% 0.33% ADPF (MJ eq) 195 33.9 11.1 69.4 13.3 63.7 946 9.07 5.55 15% 2.5% 0.83% 5.2% 0.99% 4.7% 70% 0.67% 0.41% ADPE (kg Sb eq) 2.55x10⁻⁵ 7.81x10⁻⁶ 8.41x10⁻⁷ 6.15x10⁻⁶ 1.76x10⁻⁶ 6.46x10⁻⁶ 1.24x10⁻⁴ 2.09x10⁻⁶ 2.28x10⁻⁷ 15% 4.5% 0.48% 3.5% 1% 3.7% 71% 1.2% 0.13% TRACI GWP (kg CO2 eq) 11.8 2.41 1.35 5.60 1.31 3.01 89.9 0.646 8.99 9.4% 1.9% 1.1% 4.5% 1% 2.4% 72% 0.52% 7.2% AP (kg SO2 eq) 4.13x10⁻² 9.55x10⁻³ 2.34x10⁻³ 4.55x10⁻² 4.27x10⁻³ 1.13x10⁻² 0.303 2.56x10⁻³ 2.85x10⁻³ 9.8% 2.3% 0.55% 11% 1% 2.7% 72% 0.6% 0.67% EP (kg N eq) 3.95x10⁻² 2.27x10⁻³ 3.08x10⁻² 8.40x10⁻³ 3.11x10⁻² 8.01x10⁻³ 1.67 6.07x10⁻⁴ 0.484 1.7% 0.1% 1.4% 0.37% 1.4% 0.35% 73% 0.027% 21% SFP (kg O3 eq) 0.435 0.241 3.97x10⁻² 1.36 9.01x10⁻² 0.137 6.38 6.45x10⁻² 4.35x10⁻² 4.9% 2.7% 0.45% 16% 1% 1.6% 73% 0.73% 0.49% ODP (kg CFC-11 eq) 3.24x10⁻⁷ 4.22x10⁻⁸ 1.30x10⁻⁸ 7.50x10⁻⁸ 1.93x10⁻⁸ 6.87x10⁻⁸ 1.37x10⁻⁶ 1.13x10⁻⁸ 6.71x10⁻⁹ 17% 2.2% 0.67% 3.9% 1% 3.5% 71% 0.58% 0.35% FFD (MJ surplus) 24.5 4.81 1.48 9.36 1.73 8.44 123 1.29 0.775 14% 2.7% 0.84% 5.3% 0.99% 4.8% 70% 0.74% 0.44%

Environmental Product Declaration Ecore International | Rubber Flooring ………………………………………………………………………………………………..………………………………………………………………………………………… 25 © 2025 SCSglobalServices.com Table 26. Resource use and waste flows for the flooring products over a 75-yr time horizon. Results reported in MJ are calculated using lower heating values. All values are rounded to three significant digits (Performance UltraTile /ECOmax 1"- High color) Parameter A1 A2 A3 A4 A5 B2 B4 C2 C4 Resources RPRE (MJ) 6.37 0.437 11.8 1.78 0.516 2.28 37.3 0.117 0.120 10% 0.72% 19% 2.9% 0.85% 3.8% 61% 0.19% 0.2% RPRM (MJ) 0.00 0.00 0.00 0.00 0.311 0.00 22.6 0.00 0.00 0% 0% 0% 0% 1.4% 0% 99% 0% 0% NRPRE (MJ) -95.3 34.3 16.0 71.0 14.2 65.7 152 9.19 5.68 -35% 13% 5.9% 26% 5.2% 24% 56% 3.4% 2.1% NRPRM (MJ) 308 0.00 0.00 0.00 3.61x10⁻² 0.00 865 0.00 0.00 26% 0% 0% 0% 0.0031% 0% 74% 0% 0% SM (kg) 16.2 0.00 0.00 0.00 0.649 0.00 47.2 0.00 0.00 25% 0% 0% 0% 1% 0% 74% 0% 0% RSF/NRSF (MJ) 0.00 0.00 0.00 0.00 0.00 0.00 0.00 0.00 0.00 RE (MJ) 0.00 0.00 0.00 0.00 0.00 0.00 0.00 0.00 0.00 FW (m3) 0.895 2.62x10⁻² 6.53x10⁻² 7.80x10⁻² 4.35x10⁻² 0.675 3.14 7.02x10⁻³ 7.34x10⁻³ 18% 0.53% 1.3% 1.6% 0.88% 14% 64% 0.14% 0.15% Wastes HWD (kg) 2.58x10⁻³ 2.22x10⁻⁴ 8.30x10⁻⁵ 4.61x10⁻⁴ 1.40x10⁻⁴ 9.65x10⁻⁴ 1.00x10⁻² 5.94x10⁻⁵ 3.91x10⁻⁵ 18% 1.5% 0.57% 3.2% 0.96% 6.6% 69% 0.41% 0.27% NHWD (kg) 0.720 1.67 1.45 1.06 1.42 0.137 78.4 0.446 21.2 0.68% 1.6% 1.4% 1% 1.3% 0.13% 74% 0.42% 20% HLRW (kg) 5.71x10⁻⁵ 2.05x10⁻⁶ 1.39x10⁻⁵ 7.13x10⁻⁶ 3.27x10⁻⁶ 9.17x10⁻⁶ 2.37x10⁻⁴ 5.49x10⁻⁷ 5.53x10⁻⁷ 17% 0.62% 4.2% 2.2% 0.99% 2.8% 72% 0.17% 0.17% ILLRW (kg) 2.00x10⁻⁴ 4.89x10⁻⁶ 5.60x10⁻⁵ 1.76x10⁻⁵ 1.13x10⁻⁵ 2.16x10⁻⁵ 8.17x10⁻⁴ 1.31x10⁻⁶ 1.33x10⁻⁶ 18% 0.43% 5% 1.6% 1% 1.9% 72% 0.12% 0.12% CRU (kg) 0.00 0.00 0.00 0.00 0.00 0.00 0.00 0.00 0.00 MR (kg) 0.00 0.00 0.00 0.00 1.27x10⁻² 0.00 3.55x10⁻² 0.00 0.00 0% 0% 0% 0% 26% 0% 74% 0% 0% MER (kg) 0.00 0.00 0.00 0.00 0.00 0.00 0.00 0.00 0.00 EE (MJ) 0.00 0.00 0.00 0.00 0.00 0.00 0.00 0.00 0.00

Environmental Product Declaration Ecore International | Rubber Flooring ………………………………………………………………………………………………..…………………………………………………………………………………………………………… 26 Table 27. Life Cycle Impact Assessment results for the flooring products over a 75-yr time horizon. Results reported in MJ are calculated using lower heating values. All values are rounded to three significant digits. (ECOfit/Performance Motivate) Impact Category A1 A2 A3 A4 A5 B2 B4 C2 C4 CML GWP (kg CO2 eq) 7.45 1.56 3.43 1.09 1.06 3.01 81.6 0.321 5.49 7.1% 1.5% 3.3% 1% 1% 2.9% 78% 0.31% 5.2% AP (kg SO2 eq) 2.72x10⁻² 5.15x10⁻³ 7.26x10⁻³ 6.18x10⁻³ 2.05x10⁻³ 1.02x10⁻² 0.200 1.06x10⁻³ 1.06x10⁻³ 10% 2% 2.8% 2.4% 0.79% 3.9% 77% 0.41% 0.41% EP (kg (PO4)3- eq) 1.37x10⁻² 1.30x10⁻³ 1.22x10⁻² 1.64x10⁻³ 1.15x10⁻² 3.96x10⁻³ 0.511 2.68x10⁻⁴ 8.71x10⁻² 2.1% 0.2% 1.9% 0.25% 1.8% 0.62% 80% 0.042% 14% POCP (kg C2H4 eq) 2.26x10⁻³ 2.48x10⁻⁴ 8.77x10⁻⁴ 2.22x10⁻⁴ 2.18x10⁻⁴ 7.07x10⁻⁴ 2.02x10⁻² 5.12x10⁻⁵ 1.18x10⁻³ 8.7% 0.96% 3.4% 0.86% 0.84% 2.7% 78% 0.2% 4.5% ODP (kg CFC-11 eq) 1.65x10⁻⁷ 2.06x10⁻⁸ 3.76x10⁻⁸ 1.16x10⁻⁸ 1.02x10⁻⁸ 4.83x10⁻⁸ 1.01x10⁻⁶ 4.25x10⁻⁹ 2.40x10⁻⁹ 13% 1.6% 2.9% 0.89% 0.78% 3.7% 77% 0.33% 0.18% ADPF (MJ eq) 134 21.8 48.8 14.0 9.53 63.7 942 4.50 2.76 11% 1.8% 3.9% 1.1% 0.77% 5.1% 76% 0.36% 0.22% ADPE (kg Sb eq) 1.87x10⁻⁵ 5.03x10⁻⁶ 2.65x10⁻⁶ 1.80x10⁻⁶ 1.26x10⁻⁶ 6.46x10⁻⁶ 1.22x10⁻⁴ 1.04x10⁻⁶ 1.13x10⁻⁷ 12% 3.2% 1.7% 1.1% 0.79% 4.1% 77% 0.65% 0.071% TRACI GWP (kg CO2 eq) 7.45 1.56 3.31 1.09 0.997 3.01 76.8 0.321 4.47 7.5% 1.6% 3.3% 1.1% 1% 3% 78% 0.32% 4.5% AP (kg SO2 eq) 2.93x10⁻² 6.15x10⁻³ 8.19x10⁻³ 7.79x10⁻³ 2.34x10⁻³ 1.13x10⁻² 0.226 1.27x10⁻³ 1.42x10⁻³ 10% 2.1% 2.8% 2.7% 0.8% 3.8% 77% 0.43% 0.48% EP (kg N eq) 2.77x10⁻² 1.46x10⁻³ 3.08x10⁻² 1.47x10⁻³ 3.13x10⁻² 8.01x10⁻³ 1.33 3.01x10⁻⁴ 0.240 1.7% 0.087% 1.8% 0.088% 1.9% 0.48% 80% 0.018% 14% SFP (kg O3 eq) 0.311 0.155 0.131 0.226 3.94x10⁻² 0.137 3.66 3.20x10⁻² 2.16x10⁻² 6.6% 3.3% 2.8% 4.8% 0.84% 2.9% 78% 0.68% 0.46% ODP (kg CFC-11 eq) 2.10x10⁻⁷ 2.72x10⁻⁸ 5.76x10⁻⁸ 1.58x10⁻⁸ 1.34x10⁻⁸ 6.87x10⁻⁸ 1.33x10⁻⁶ 5.60x10⁻⁹ 3.33x10⁻⁹ 12% 1.6% 3.3% 0.91% 0.77% 4% 77% 0.32% 0.19% FFD (MJ surplus) 17.1 3.10 6.61 1.91 1.26 8.44 124 0.640 0.385 10% 1.9% 4% 1.2% 0.77% 5.2% 76% 0.39% 0.24%

Environmental Product Declaration Ecore International | Rubber Flooring ………………………………………………………………………………………………..………………………………………………………………………………………… 27 © 2025 SCSglobalServices.com Table 28. Resource use and waste flows for the flooring products over a 75-yr time horizon. Results reported in MJ are calculated using lower heating values. All values are rounded to three significant digits (ECOfit/Performance Motivate) Parameter A1 A2 A3 A4 A5 B2 B4 C2 C4 Resources RPRE (MJ) 4.38 0.282 13.9 0.306 0.438 2.28 44.9 5.81x10⁻² 5.95x10⁻² 6.6% 0.42% 21% 0.46% 0.66% 3.4% 67% 0.087% 0.089% RPRM (MJ) 0.00 0.00 0.00 0.00 0.328 0.00 34.1 0.00 0.00 0% 0% 0% 0% 0.95% 0% 99% 0% 0% NRPRE (MJ) 38.7 22.1 69.2 14.3 10.2 65.7 604 4.56 2.82 4.7% 2.7% 8.3% 1.7% 1.2% 7.9% 73% 0.55% 0.34% NRPRM (MJ) 102 0.00 0.00 0.00 0.434 0.00 454 0.00 0.00 18% 0% 0% 0% 0.078% 0% 82% 0% 0% SM (kg) 5.38 0.00 0.00 0.00 0.215 0.00 22.4 0.00 0.00 19% 0% 0% 0% 0.77% 0% 80% 0% 0% RSF/NRSF (MJ) 0.00 0.00 0.00 0.00 0.00 0.00 0.00 0.00 0.00 RE (MJ) 0.00 0.00 0.00 0.00 0.00 0.00 0.00 0.00 0.00 FW (m3) 0.559 1.69x10⁻² 0.290 1.43x10⁻² 3.61x10⁻² 0.675 3.70 3.48x10⁻³ 3.64x10⁻³ 11% 0.32% 5.5% 0.27% 0.68% 13% 70% 0.066% 0.069% Wastes HWD (kg) 1.74x10⁻³ 1.43x10⁻⁴ 5.56x10⁻⁴ 9.24x10⁻⁵ 1.07x10⁻⁴ 9.65x10⁻⁴ 1.08x10⁻² 2.95x10⁻⁵ 1.94x10⁻⁵ 12% 0.99% 3.9% 0.64% 0.74% 6.7% 75% 0.2% 0.13% NHWD (kg) 0.713 1.07 1.28 0.347 1.09 0.137 61.0 0.222 10.5 0.93% 1.4% 1.7% 0.45% 1.4% 0.18% 80% 0.29% 14% HLRW (kg) 2.55x10⁻⁵ 1.32x10⁻⁶ 5.92x10⁻⁵ 1.26x10⁻⁶ 3.54x10⁻⁶ 9.17x10⁻⁶ 3.66x10⁻⁴ 2.73x10⁻⁷ 2.75x10⁻⁷ 5.5% 0.28% 13% 0.27% 0.76% 2% 78% 0.059% 0.059% ILLRW (kg) 7.81x10⁻⁵ 3.15x10⁻⁶ 2.37x10⁻⁴ 3.09x10⁻⁶ 1.30x10⁻⁵ 2.16x10⁻⁵ 1.34x10⁻³ 6.49x10⁻⁷ 6.58x10⁻⁷ 4.6% 0.19% 14% 0.18% 0.76% 1.3% 79% 0.038% 0.039% CRU (kg) 0.00 0.00 0.00 0.00 0.00 0.00 0.00 0.00 0.00 MR (kg) 0.00 0.00 0.00 0.00 0.111 0.00 0.445 0.00 0.00 0% 0% 0% 0% 20% 0% 80% 0% 0% MER (kg) 0.00 0.00 0.00 0.00 0.00 0.00 0.00 0.00 0.00 EE (MJ) 0.00 0.00 0.00 0.00 0.00 0.00 0.00 0.00 0.00
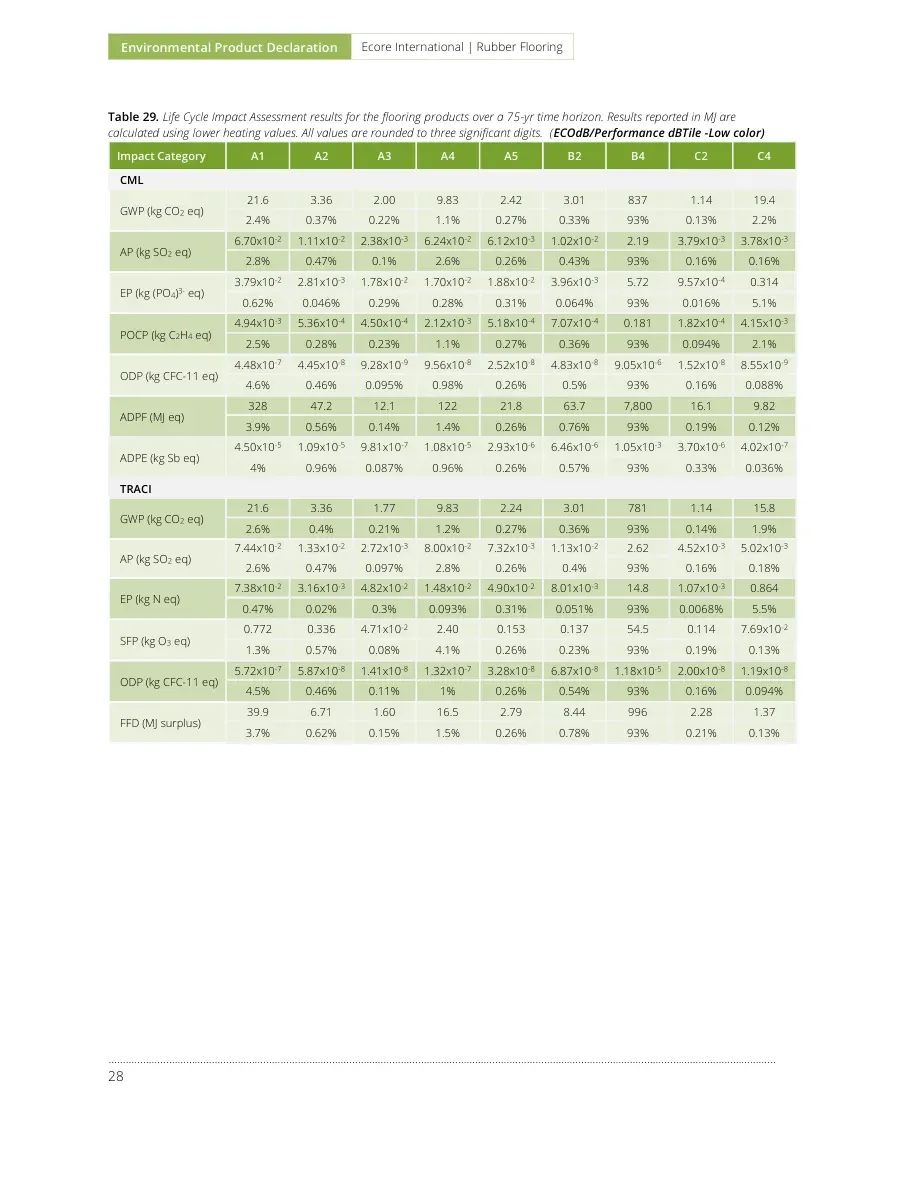
Environmental Product Declaration Ecore International | Rubber Flooring ………………………………………………………………………………………………..…………………………………………………………………………………………………………… 28 Table 29. Life Cycle Impact Assessment results for the flooring products over a 75-yr time horizon. Results reported in MJ are calculated using lower heating values. All values are rounded to three significant digits. (ECOdB/Performance dBTile -Low color) Impact Category A1 A2 A3 A4 A5 B2 B4 C2 C4 CML GWP (kg CO2 eq) 21.6 3.36 2.00 9.83 2.42 3.01 837 1.14 19.4 2.4% 0.37% 0.22% 1.1% 0.27% 0.33% 93% 0.13% 2.2% AP (kg SO2 eq) 6.70x10⁻² 1.11x10⁻² 2.38x10⁻³ 6.24x10⁻² 6.12x10⁻³ 1.02x10⁻² 2.19 3.79x10⁻³ 3.78x10⁻³ 2.8% 0.47% 0.1% 2.6% 0.26% 0.43% 93% 0.16% 0.16% EP (kg (PO4)3- eq) 3.79x10⁻² 2.81x10⁻³ 1.78x10⁻² 1.70x10⁻² 1.88x10⁻² 3.96x10⁻³ 5.72 9.57x10⁻⁴ 0.314 0.62% 0.046% 0.29% 0.28% 0.31% 0.064% 93% 0.016% 5.1% POCP (kg C2H4 eq) 4.94x10⁻³ 5.36x10⁻⁴ 4.50x10⁻⁴ 2.12x10⁻³ 5.18x10⁻⁴ 7.07x10⁻⁴ 0.181 1.82x10⁻⁴ 4.15x10⁻³ 2.5% 0.28% 0.23% 1.1% 0.27% 0.36% 93% 0.094% 2.1% ODP (kg CFC-11 eq) 4.48x10⁻⁷ 4.45x10⁻⁸ 9.28x10⁻⁹ 9.56x10⁻⁸ 2.52x10⁻⁸ 4.83x10⁻⁸ 9.05x10⁻⁶ 1.52x10⁻⁸ 8.55x10⁻⁹ 4.6% 0.46% 0.095% 0.98% 0.26% 0.5% 93% 0.16% 0.088% ADPF (MJ eq) 328 47.2 12.1 122 21.8 63.7 7,800 16.1 9.82 3.9% 0.56% 0.14% 1.4% 0.26% 0.76% 93% 0.19% 0.12% ADPE (kg Sb eq) 4.50x10⁻⁵ 1.09x10⁻⁵ 9.81x10⁻⁷ 1.08x10⁻⁵ 2.93x10⁻⁶ 6.46x10⁻⁶ 1.05x10⁻³ 3.70x10⁻⁶ 4.02x10⁻⁷ 4% 0.96% 0.087% 0.96% 0.26% 0.57% 93% 0.33% 0.036% TRACI GWP (kg CO2 eq) 21.6 3.36 1.77 9.83 2.24 3.01 781 1.14 15.8 2.6% 0.4% 0.21% 1.2% 0.27% 0.36% 93% 0.14% 1.9% AP (kg SO2 eq) 7.44x10⁻² 1.33x10⁻² 2.72x10⁻³ 8.00x10⁻² 7.32x10⁻³ 1.13x10⁻² 2.62 4.52x10⁻³ 5.02x10⁻³ 2.6% 0.47% 0.097% 2.8% 0.26% 0.4% 93% 0.16% 0.18% EP (kg N eq) 7.38x10⁻² 3.16x10⁻³ 4.82x10⁻² 1.48x10⁻² 4.90x10⁻² 8.01x10⁻³ 14.8 1.07x10⁻³ 0.864 0.47% 0.02% 0.3% 0.093% 0.31% 0.051% 93% 0.0068% 5.5% SFP (kg O3 eq) 0.772 0.336 4.71x10⁻² 2.40 0.153 0.137 54.5 0.114 7.69x10⁻² 1.3% 0.57% 0.08% 4.1% 0.26% 0.23% 93% 0.19% 0.13% ODP (kg CFC-11 eq) 5.72x10⁻⁷ 5.87x10⁻⁸ 1.41x10⁻⁸ 1.32x10⁻⁷ 3.28x10⁻⁸ 6.87x10⁻⁸ 1.18x10⁻⁵ 2.00x10⁻⁸ 1.19x10⁻⁸ 4.5% 0.46% 0.11% 1% 0.26% 0.54% 93% 0.16% 0.094% FFD (MJ surplus) 39.9 6.71 1.60 16.5 2.79 8.44 996 2.28 1.37 3.7% 0.62% 0.15% 1.5% 0.26% 0.78% 93% 0.21% 0.13%
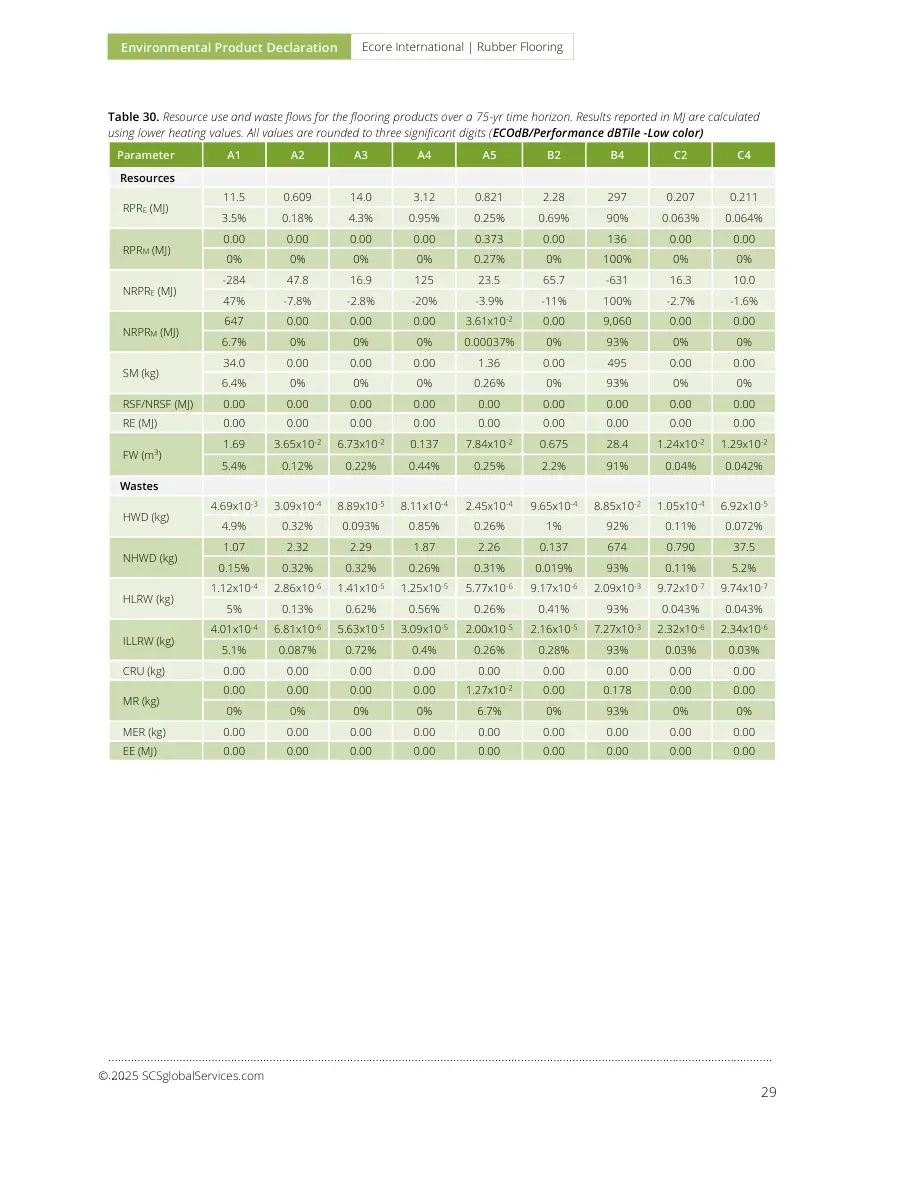
Environmental Product Declaration Ecore International | Rubber Flooring ………………………………………………………………………………………………..………………………………………………………………………………………… 29 © 2025 SCSglobalServices.com Table 30. Resource use and waste flows for the flooring products over a 75-yr time horizon. Results reported in MJ are calculated using lower heating values. All values are rounded to three significant digits (ECOdB/Performance dBTile -Low color) Parameter A1 A2 A3 A4 A5 B2 B4 C2 C4 Resources RPRE (MJ) 11.5 0.609 14.0 3.12 0.821 2.28 297 0.207 0.211 3.5% 0.18% 4.3% 0.95% 0.25% 0.69% 90% 0.063% 0.064% RPRM (MJ) 0.00 0.00 0.00 0.00 0.373 0.00 136 0.00 0.00 0% 0% 0% 0% 0.27% 0% 100% 0% 0% NRPRE (MJ) -284 47.8 16.9 125 23.5 65.7 -631 16.3 10.0 47% -7.8% -2.8% -20% -3.9% -11% 100% -2.7% -1.6% NRPRM (MJ) 647 0.00 0.00 0.00 3.61x10⁻² 0.00 9,060 0.00 0.00 6.7% 0% 0% 0% 0.00037% 0% 93% 0% 0% SM (kg) 34.0 0.00 0.00 0.00 1.36 0.00 495 0.00 0.00 6.4% 0% 0% 0% 0.26% 0% 93% 0% 0% RSF/NRSF (MJ) 0.00 0.00 0.00 0.00 0.00 0.00 0.00 0.00 0.00 RE (MJ) 0.00 0.00 0.00 0.00 0.00 0.00 0.00 0.00 0.00 FW (m3) 1.69 3.65x10⁻² 6.73x10⁻² 0.137 7.84x10⁻² 0.675 28.4 1.24x10⁻² 1.29x10⁻² 5.4% 0.12% 0.22% 0.44% 0.25% 2.2% 91% 0.04% 0.042% Wastes HWD (kg) 4.69x10⁻³ 3.09x10⁻⁴ 8.89x10⁻⁵ 8.11x10⁻⁴ 2.45x10⁻⁴ 9.65x10⁻⁴ 8.85x10⁻² 1.05x10⁻⁴ 6.92x10⁻⁵ 4.9% 0.32% 0.093% 0.85% 0.26% 1% 92% 0.11% 0.072% NHWD (kg) 1.07 2.32 2.29 1.87 2.26 0.137 674 0.790 37.5 0.15% 0.32% 0.32% 0.26% 0.31% 0.019% 93% 0.11% 5.2% HLRW (kg) 1.12x10⁻⁴ 2.86x10⁻⁶ 1.41x10⁻⁵ 1.25x10⁻⁵ 5.77x10⁻⁶ 9.17x10⁻⁶ 2.09x10⁻³ 9.72x10⁻⁷ 9.74x10⁻⁷ 5% 0.13% 0.62% 0.56% 0.26% 0.41% 93% 0.043% 0.043% ILLRW (kg) 4.01x10⁻⁴ 6.81x10⁻⁶ 5.63x10⁻⁵ 3.09x10⁻⁵ 2.00x10⁻⁵ 2.16x10⁻⁵ 7.27x10⁻³ 2.32x10⁻⁶ 2.34x10⁻⁶ 5.1% 0.087% 0.72% 0.4% 0.26% 0.28% 93% 0.03% 0.03% CRU (kg) 0.00 0.00 0.00 0.00 0.00 0.00 0.00 0.00 0.00 MR (kg) 0.00 0.00 0.00 0.00 1.27x10⁻² 0.00 0.178 0.00 0.00 0% 0% 0% 0% 6.7% 0% 93% 0% 0% MER (kg) 0.00 0.00 0.00 0.00 0.00 0.00 0.00 0.00 0.00 EE (MJ) 0.00 0.00 0.00 0.00 0.00 0.00 0.00 0.00 0.00
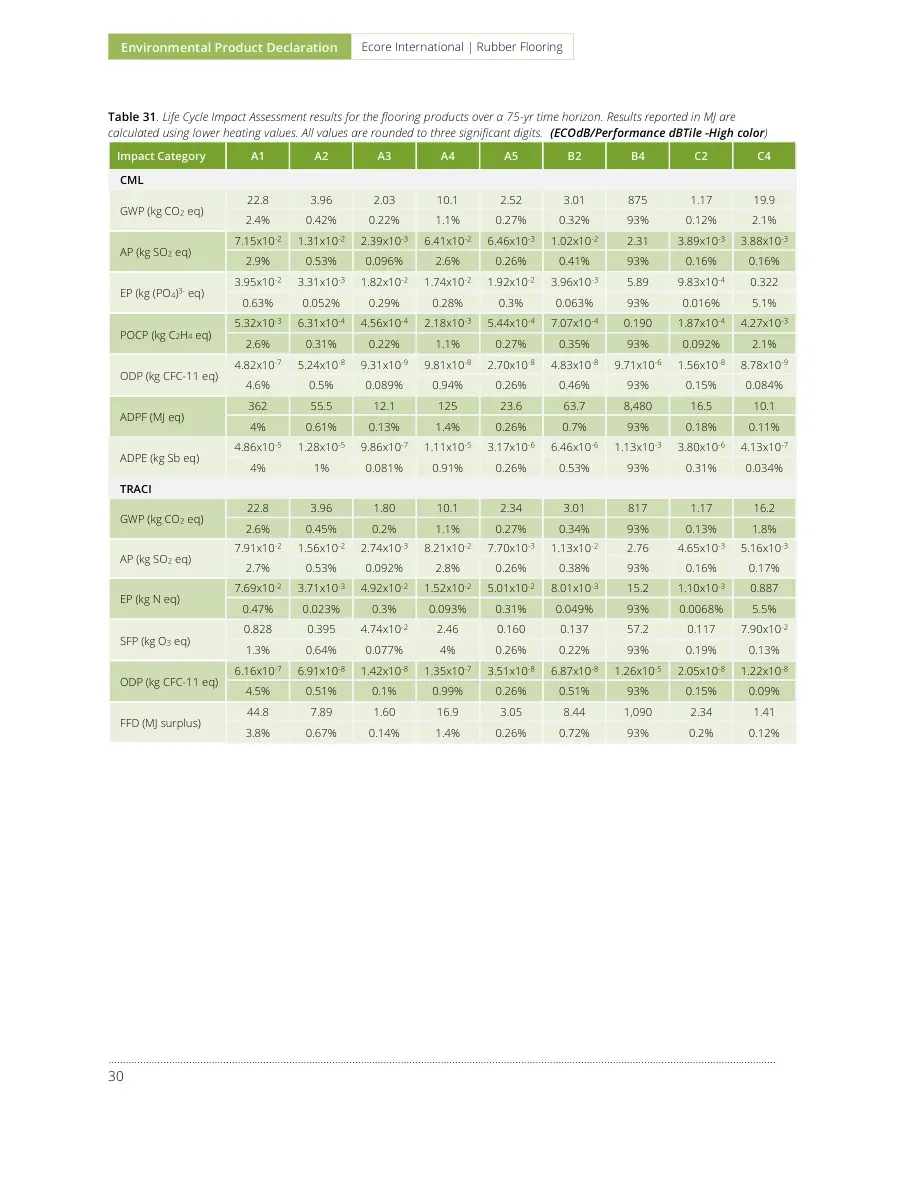
Environmental Product Declaration Ecore International | Rubber Flooring ………………………………………………………………………………………………..…………………………………………………………………………………………………………… 30 Table 31. Life Cycle Impact Assessment results for the flooring products over a 75-yr time horizon. Results reported in MJ are calculated using lower heating values. All values are rounded to three significant digits. (ECOdB/Performance dBTile -High color) Impact Category A1 A2 A3 A4 A5 B2 B4 C2 C4 CML GWP (kg CO2 eq) 22.8 3.96 2.03 10.1 2.52 3.01 875 1.17 19.9 2.4% 0.42% 0.22% 1.1% 0.27% 0.32% 93% 0.12% 2.1% AP (kg SO2 eq) 7.15x10⁻² 1.31x10⁻² 2.39x10⁻³ 6.41x10⁻² 6.46x10⁻³ 1.02x10⁻² 2.31 3.89x10⁻³ 3.88x10⁻³ 2.9% 0.53% 0.096% 2.6% 0.26% 0.41% 93% 0.16% 0.16% EP (kg (PO4)3- eq) 3.95x10⁻² 3.31x10⁻³ 1.82x10⁻² 1.74x10⁻² 1.92x10⁻² 3.96x10⁻³ 5.89 9.83x10⁻⁴ 0.322 0.63% 0.052% 0.29% 0.28% 0.3% 0.063% 93% 0.016% 5.1% POCP (kg C2H4 eq) 5.32x10⁻³ 6.31x10⁻⁴ 4.56x10⁻⁴ 2.18x10⁻³ 5.44x10⁻⁴ 7.07x10⁻⁴ 0.190 1.87x10⁻⁴ 4.27x10⁻³ 2.6% 0.31% 0.22% 1.1% 0.27% 0.35% 93% 0.092% 2.1% ODP (kg CFC-11 eq) 4.82x10⁻⁷ 5.24x10⁻⁸ 9.31x10⁻⁹ 9.81x10⁻⁸ 2.70x10⁻⁸ 4.83x10⁻⁸ 9.71x10⁻⁶ 1.56x10⁻⁸ 8.78x10⁻⁹ 4.6% 0.5% 0.089% 0.94% 0.26% 0.46% 93% 0.15% 0.084% ADPF (MJ eq) 362 55.5 12.1 125 23.6 63.7 8,480 16.5 10.1 4% 0.61% 0.13% 1.4% 0.26% 0.7% 93% 0.18% 0.11% ADPE (kg Sb eq) 4.86x10⁻⁵ 1.28x10⁻⁵ 9.86x10⁻⁷ 1.11x10⁻⁵ 3.17x10⁻⁶ 6.46x10⁻⁶ 1.13x10⁻³ 3.80x10⁻⁶ 4.13x10⁻⁷ 4% 1% 0.081% 0.91% 0.26% 0.53% 93% 0.31% 0.034% TRACI GWP (kg CO2 eq) 22.8 3.96 1.80 10.1 2.34 3.01 817 1.17 16.2 2.6% 0.45% 0.2% 1.1% 0.27% 0.34% 93% 0.13% 1.8% AP (kg SO2 eq) 7.91x10⁻² 1.56x10⁻² 2.74x10⁻³ 8.21x10⁻² 7.70x10⁻³ 1.13x10⁻² 2.76 4.65x10⁻³ 5.16x10⁻³ 2.7% 0.53% 0.092% 2.8% 0.26% 0.38% 93% 0.16% 0.17% EP (kg N eq) 7.69x10⁻² 3.71x10⁻³ 4.92x10⁻² 1.52x10⁻² 5.01x10⁻² 8.01x10⁻³ 15.2 1.10x10⁻³ 0.887 0.47% 0.023% 0.3% 0.093% 0.31% 0.049% 93% 0.0068% 5.5% SFP (kg O3 eq) 0.828 0.395 4.74x10⁻² 2.46 0.160 0.137 57.2 0.117 7.90x10⁻² 1.3% 0.64% 0.077% 4% 0.26% 0.22% 93% 0.19% 0.13% ODP (kg CFC-11 eq) 6.16x10⁻⁷ 6.91x10⁻⁸ 1.42x10⁻⁸ 1.35x10⁻⁷ 3.51x10⁻⁸ 6.87x10⁻⁸ 1.26x10⁻⁵ 2.05x10⁻⁸ 1.22x10⁻⁸ 4.5% 0.51% 0.1% 0.99% 0.26% 0.51% 93% 0.15% 0.09% FFD (MJ surplus) 44.8 7.89 1.60 16.9 3.05 8.44 1,090 2.34 1.41 3.8% 0.67% 0.14% 1.4% 0.26% 0.72% 93% 0.2% 0.12%

Environmental Product Declaration Ecore International | Rubber Flooring ………………………………………………………………………………………………..………………………………………………………………………………………… 31 © 2025 SCSglobalServices.com Table 32. Resource use and waste flows for the flooring products over a 75-yr time horizon. Results reported in MJ are calculated using lower heating values. All values are rounded to three significant digits (ECOdB/Performance dBTile -High color) Parameter A1 A2 A3 A4 A5 B2 B4 C2 C4 Resources RPRE (MJ) 12.2 0.716 14.0 3.21 0.856 2.28 310 0.213 0.217 3.6% 0.21% 4.1% 0.93% 0.25% 0.66% 90% 0.062% 0.063% RPRM (MJ) 0.00 0.00 0.00 0.00 0.373 0.00 136 0.00 0.00 0% 0% 0% 0% 0.27% 0% 100% 0% 0% NRPRE (MJ) -208 56.3 17.0 128 25.3 65.7 633 16.7 10.3 -28% 7.6% 2.3% 17% 3.4% 8.8% 85% 2.2% 1.4% NRPRM (MJ) 604 0.00 0.00 0.00 3.61x10⁻² 0.00 8,470 0.00 0.00 6.7% 0% 0% 0% 0.0004% 0% 93% 0% 0% SM (kg) 31.8 0.00 0.00 0.00 1.27 0.00 463 0.00 0.00 6.4% 0% 0% 0% 0.26% 0% 93% 0% 0% RSF/NRSF (MJ) 0.00 0.00 0.00 0.00 0.00 0.00 0.00 0.00 0.00 RE (MJ) 0.00 0.00 0.00 0.00 0.00 0.00 0.00 0.00 0.00 FW (m3) 1.75 4.29x10⁻² 6.74x10⁻² 0.141 8.13x10⁻² 0.675 29.5 1.28x10⁻² 1.33x10⁻² 5.4% 0.13% 0.21% 0.44% 0.25% 2.1% 91% 0.04% 0.041% Wastes HWD (kg) 4.99x10⁻³ 3.64x10⁻⁴ 8.91x10⁻⁵ 8.32x10⁻⁴ 2.61x10⁻⁴ 9.65x10⁻⁴ 9.41x10⁻² 1.08x10⁻⁴ 7.11x10⁻⁵ 4.9% 0.36% 0.088% 0.82% 0.26% 0.95% 92% 0.11% 0.07% NHWD (kg) 1.27 2.73 2.35 1.92 2.33 0.137 699 0.811 38.6 0.17% 0.36% 0.31% 0.26% 0.31% 0.018% 93% 0.11% 5.1% HLRW (kg) 1.11x10⁻⁴ 3.36x10⁻⁶ 1.41x10⁻⁵ 1.29x10⁻⁵ 5.74x10⁻⁶ 9.17x10⁻⁶ 2.08x10⁻³ 9.99x10⁻⁷ 1.00x10⁻⁶ 4.9% 0.15% 0.63% 0.57% 0.26% 0.41% 93% 0.045% 0.045% ILLRW (kg) 3.88x10⁻⁴ 8.01x10⁻⁶ 5.63x10⁻⁵ 3.17x10⁻⁵ 1.96x10⁻⁵ 2.16x10⁻⁵ 7.12x10⁻³ 2.38x10⁻⁶ 2.40x10⁻⁶ 5.1% 0.1% 0.74% 0.41% 0.26% 0.28% 93% 0.031% 0.031% CRU (kg) 0.00 0.00 0.00 0.00 0.00 0.00 0.00 0.00 0.00 MR (kg) 0.00 0.00 0.00 0.00 1.27x10⁻² 0.00 0.178 0.00 0.00 0% 0% 0% 0% 6.7% 0% 93% 0% 0% MER (kg) 0.00 0.00 0.00 0.00 0.00 0.00 0.00 0.00 0.00 EE (MJ) 0.00 0.00 0.00 0.00 0.00 0.00 0.00 0.00 0.00

Environmental Product Declaration Ecore International | Rubber Flooring ………………………………………………………………………………………………..…………………………………………………………………………………………………………… 32 Table 33. Life Cycle Impact Assessment results for the flooring products over a 75-yr time horizon. Results reported in MJ are calculated using lower heating values. All values are rounded to three significant digits. (PlayGuard - 2.5"/ECOmax 2.5"; Low color) Impact Category A1 A2 A3 A4 A5 B2 B4 C2 C4 CML GWP (kg CO2 eq) 17.7 2.98 1.88 8.71 2.09 3.01 144 1.01 17.3 8.9% 1.5% 0.94% 4.4% 1% 1.5% 73% 0.51% 8.7% AP (kg SO2 eq) 5.46x10⁻² 9.86x10⁻³ 2.34x10⁻³ 5.53x10⁻² 5.25x10⁻³ 1.02x10⁻² 0.375 3.35x10⁻³ 3.35x10⁻³ 11% 1.9% 0.45% 11% 1% 2% 72% 0.64% 0.64% EP (kg (PO4)3- eq) 3.08x10⁻² 2.49x10⁻³ 1.61x10⁻² 1.50x10⁻² 1.70x10⁻² 3.96x10⁻³ 1.00 8.46x10⁻⁴ 0.275 2.3% 0.18% 1.2% 1.1% 1.2% 0.29% 73% 0.062% 20% POCP (kg C2H4 eq) 4.00x10⁻³ 4.75x10⁻⁴ 4.23x10⁻⁴ 1.88x10⁻³ 4.45x10⁻⁴ 7.07x10⁻⁴ 3.10x10⁻² 1.61x10⁻⁴ 3.70x10⁻³ 9.3% 1.1% 0.99% 4.4% 1% 1.7% 72% 0.38% 8.6% ODP (kg CFC-11 eq) 3.61x10⁻⁷ 3.95x10⁻⁸ 9.14x10⁻⁹ 8.46x10⁻⁸ 2.10x10⁻⁸ 4.83x10⁻⁸ 1.50x10⁻⁶ 1.34x10⁻⁸ 7.56x10⁻⁹ 17% 1.9% 0.44% 4.1% 1% 2.3% 72% 0.64% 0.36% ADPF (MJ eq) 267 41.8 11.9 108 18.4 63.7 1,320 14.2 8.69 14% 2.3% 0.65% 5.8% 1% 3.4% 71% 0.77% 0.47% ADPE (kg Sb eq) 3.62x10⁻⁵ 9.63x10⁻⁶ 9.57x10⁻⁷ 9.57x10⁻⁶ 2.46x10⁻⁶ 6.46x10⁻⁶ 1.75x10⁻⁴ 3.27x10⁻⁶ 3.56x10⁻⁷ 15% 4% 0.39% 3.9% 1% 2.7% 72% 1.3% 0.15% TRACI GWP (kg CO2 eq) 17.7 2.98 1.67 8.71 1.94 3.01 134 1.01 14.0 9.5% 1.6% 0.9% 4.7% 1% 1.6% 72% 0.55% 7.6% AP (kg SO2 eq) 6.05x10⁻² 1.18x10⁻² 2.67x10⁻³ 7.08x10⁻² 6.29x10⁻³ 1.13x10⁻² 0.450 4.00x10⁻³ 4.46x10⁻³ 9.7% 1.9% 0.43% 11% 1% 1.8% 72% 0.64% 0.72% EP (kg N eq) 6.02x10⁻² 2.80x10⁻³ 4.36x10⁻² 1.31x10⁻² 4.45x10⁻² 8.01x10⁻³ 2.58 9.49x10⁻⁴ 0.758 1.7% 0.08% 1.2% 0.37% 1.3% 0.23% 74% 0.027% 22% SFP (kg O3 eq) 0.627 0.297 4.60x10⁻² 2.12 0.134 0.137 9.51 0.101 6.80x10⁻² 4.8% 2.3% 0.35% 16% 1% 1% 73% 0.77% 0.52% ODP (kg CFC-11 eq) 4.64x10⁻⁷ 5.20x10⁻⁸ 1.39x10⁻⁸ 1.17x10⁻⁷ 2.74x10⁻⁸ 6.87x10⁻⁸ 1.96x10⁻⁶ 1.77x10⁻⁸ 1.05x10⁻⁸ 17% 1.9% 0.51% 4.3% 1% 2.5% 72% 0.65% 0.38% FFD (MJ surplus) 32.4 5.94 1.58 14.6 2.36 8.44 168 2.02 1.21 14% 2.5% 0.67% 6.2% 1% 3.6% 71% 0.85% 0.51%
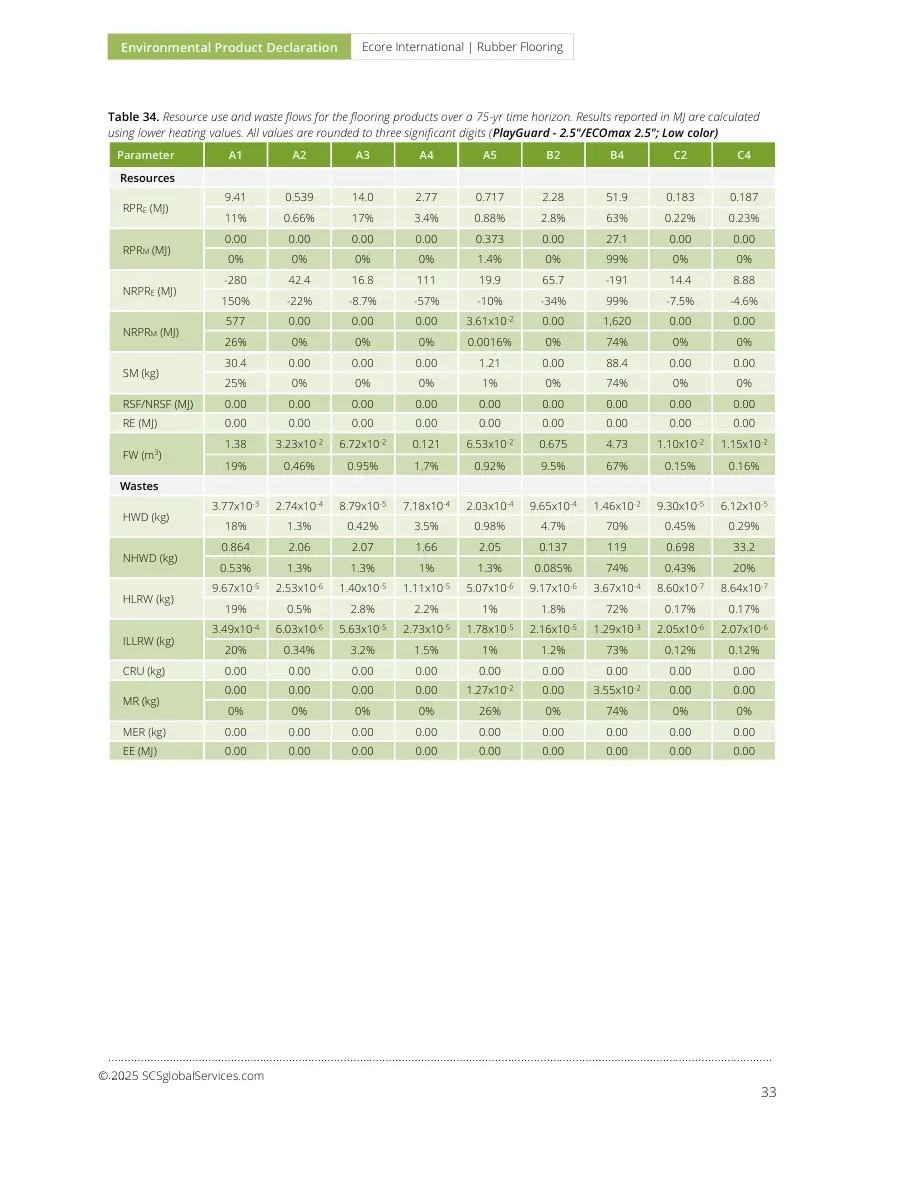
Environmental Product Declaration Ecore International | Rubber Flooring ………………………………………………………………………………………………..………………………………………………………………………………………… 33 © 2025 SCSglobalServices.com Table 34. Resource use and waste flows for the flooring products over a 75-yr time horizon. Results reported in MJ are calculated using lower heating values. All values are rounded to three significant digits (PlayGuard - 2.5"/ECOmax 2.5"; Low color) Parameter A1 A2 A3 A4 A5 B2 B4 C2 C4 Resources RPRE (MJ) 9.41 0.539 14.0 2.77 0.717 2.28 51.9 0.183 0.187 11% 0.66% 17% 3.4% 0.88% 2.8% 63% 0.22% 0.23% RPRM (MJ) 0.00 0.00 0.00 0.00 0.373 0.00 27.1 0.00 0.00 0% 0% 0% 0% 1.4% 0% 99% 0% 0% NRPRE (MJ) -280 42.4 16.8 111 19.9 65.7 -191 14.4 8.88 150% -22% -8.7% -57% -10% -34% 99% -7.5% -4.6% NRPRM (MJ) 577 0.00 0.00 0.00 3.61x10⁻² 0.00 1,620 0.00 0.00 26% 0% 0% 0% 0.0016% 0% 74% 0% 0% SM (kg) 30.4 0.00 0.00 0.00 1.21 0.00 88.4 0.00 0.00 25% 0% 0% 0% 1% 0% 74% 0% 0% RSF/NRSF (MJ) 0.00 0.00 0.00 0.00 0.00 0.00 0.00 0.00 0.00 RE (MJ) 0.00 0.00 0.00 0.00 0.00 0.00 0.00 0.00 0.00 FW (m3) 1.38 3.23x10⁻² 6.72x10⁻² 0.121 6.53x10⁻² 0.675 4.73 1.10x10⁻² 1.15x10⁻² 19% 0.46% 0.95% 1.7% 0.92% 9.5% 67% 0.15% 0.16% Wastes HWD (kg) 3.77x10⁻³ 2.74x10⁻⁴ 8.79x10⁻⁵ 7.18x10⁻⁴ 2.03x10⁻⁴ 9.65x10⁻⁴ 1.46x10⁻² 9.30x10⁻⁵ 6.12x10⁻⁵ 18% 1.3% 0.42% 3.5% 0.98% 4.7% 70% 0.45% 0.29% NHWD (kg) 0.864 2.06 2.07 1.66 2.05 0.137 119 0.698 33.2 0.53% 1.3% 1.3% 1% 1.3% 0.085% 74% 0.43% 20% HLRW (kg) 9.67x10⁻⁵ 2.53x10⁻⁶ 1.40x10⁻⁵ 1.11x10⁻⁵ 5.07x10⁻⁶ 9.17x10⁻⁶ 3.67x10⁻⁴ 8.60x10⁻⁷ 8.64x10⁻⁷ 19% 0.5% 2.8% 2.2% 1% 1.8% 72% 0.17% 0.17% ILLRW (kg) 3.49x10⁻⁴ 6.03x10⁻⁶ 5.63x10⁻⁵ 2.73x10⁻⁵ 1.78x10⁻⁵ 2.16x10⁻⁵ 1.29x10⁻³ 2.05x10⁻⁶ 2.07x10⁻⁶ 20% 0.34% 3.2% 1.5% 1% 1.2% 73% 0.12% 0.12% CRU (kg) 0.00 0.00 0.00 0.00 0.00 0.00 0.00 0.00 0.00 MR (kg) 0.00 0.00 0.00 0.00 1.27x10⁻² 0.00 3.55x10⁻² 0.00 0.00 0% 0% 0% 0% 26% 0% 74% 0% 0% MER (kg) 0.00 0.00 0.00 0.00 0.00 0.00 0.00 0.00 0.00 EE (MJ) 0.00 0.00 0.00 0.00 0.00 0.00 0.00 0.00 0.00
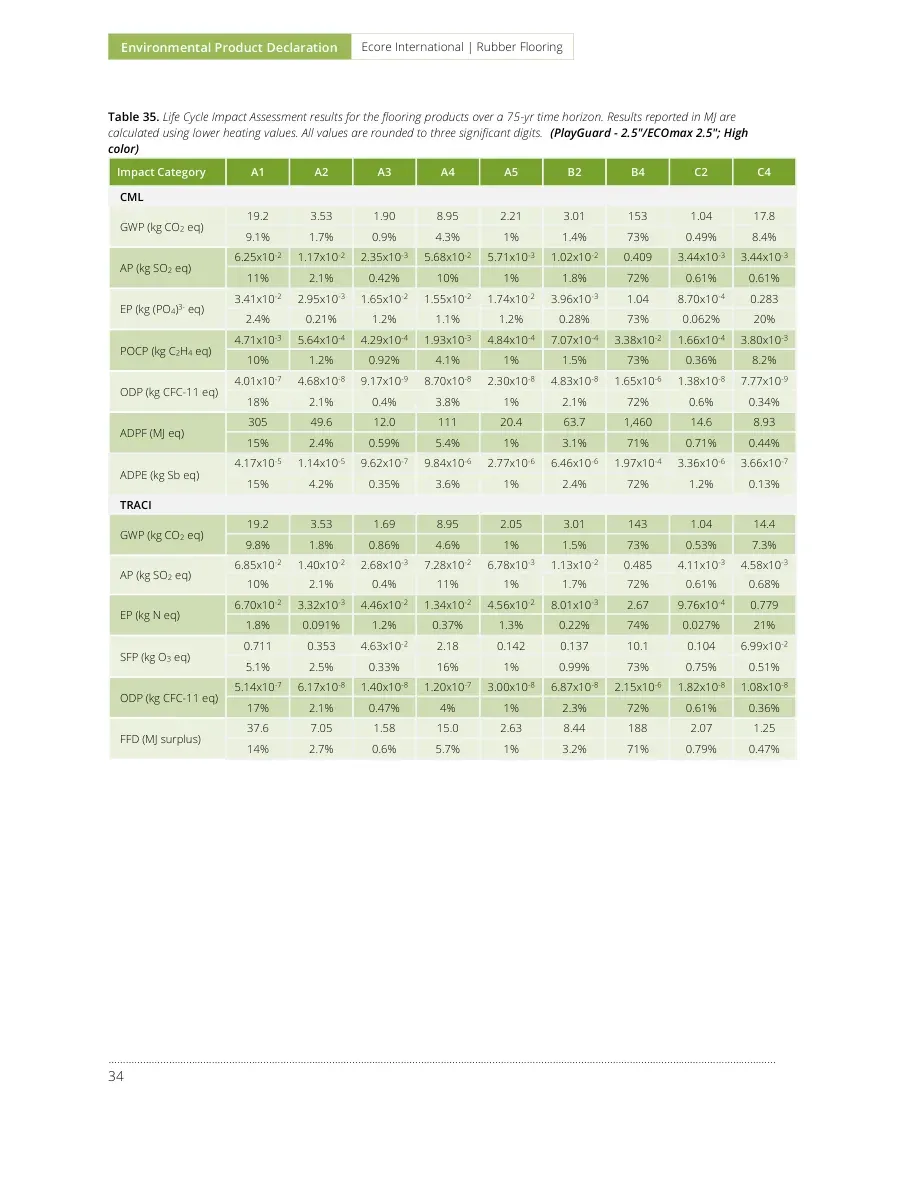
Environmental Product Declaration Ecore International | Rubber Flooring ………………………………………………………………………………………………..…………………………………………………………………………………………………………… 34 Table 35. Life Cycle Impact Assessment results for the flooring products over a 75-yr time horizon. Results reported in MJ are calculated using lower heating values. All values are rounded to three significant digits. (PlayGuard - 2.5"/ECOmax 2.5"; High color) Impact Category A1 A2 A3 A4 A5 B2 B4 C2 C4 CML GWP (kg CO2 eq) 19.2 3.53 1.90 8.95 2.21 3.01 153 1.04 17.8 9.1% 1.7% 0.9% 4.3% 1% 1.4% 73% 0.49% 8.4% AP (kg SO2 eq) 6.25x10⁻² 1.17x10⁻² 2.35x10⁻³ 5.68x10⁻² 5.71x10⁻³ 1.02x10⁻² 0.409 3.44x10⁻³ 3.44x10⁻³ 11% 2.1% 0.42% 10% 1% 1.8% 72% 0.61% 0.61% EP (kg (PO4)3- eq) 3.41x10⁻² 2.95x10⁻³ 1.65x10⁻² 1.55x10⁻² 1.74x10⁻² 3.96x10⁻³ 1.04 8.70x10⁻⁴ 0.283 2.4% 0.21% 1.2% 1.1% 1.2% 0.28% 73% 0.062% 20% POCP (kg C2H4 eq) 4.71x10⁻³ 5.64x10⁻⁴ 4.29x10⁻⁴ 1.93x10⁻³ 4.84x10⁻⁴ 7.07x10⁻⁴ 3.38x10⁻² 1.66x10⁻⁴ 3.80x10⁻³ 10% 1.2% 0.92% 4.1% 1% 1.5% 73% 0.36% 8.2% ODP (kg CFC-11 eq) 4.01x10⁻⁷ 4.68x10⁻⁸ 9.17x10⁻⁹ 8.70x10⁻⁸ 2.30x10⁻⁸ 4.83x10⁻⁸ 1.65x10⁻⁶ 1.38x10⁻⁸ 7.77x10⁻⁹ 18% 2.1% 0.4% 3.8% 1% 2.1% 72% 0.6% 0.34% ADPF (MJ eq) 305 49.6 12.0 111 20.4 63.7 1,460 14.6 8.93 15% 2.4% 0.59% 5.4% 1% 3.1% 71% 0.71% 0.44% ADPE (kg Sb eq) 4.17x10⁻⁵ 1.14x10⁻⁵ 9.62x10⁻⁷ 9.84x10⁻⁶ 2.77x10⁻⁶ 6.46x10⁻⁶ 1.97x10⁻⁴ 3.36x10⁻⁶ 3.66x10⁻⁷ 15% 4.2% 0.35% 3.6% 1% 2.4% 72% 1.2% 0.13% TRACI GWP (kg CO2 eq) 19.2 3.53 1.69 8.95 2.05 3.01 143 1.04 14.4 9.8% 1.8% 0.86% 4.6% 1% 1.5% 73% 0.53% 7.3% AP (kg SO2 eq) 6.85x10⁻² 1.40x10⁻² 2.68x10⁻³ 7.28x10⁻² 6.78x10⁻³ 1.13x10⁻² 0.485 4.11x10⁻³ 4.58x10⁻³ 10% 2.1% 0.4% 11% 1% 1.7% 72% 0.61% 0.68% EP (kg N eq) 6.70x10⁻² 3.32x10⁻³ 4.46x10⁻² 1.34x10⁻² 4.56x10⁻² 8.01x10⁻³ 2.67 9.76x10⁻⁴ 0.779 1.8% 0.091% 1.2% 0.37% 1.3% 0.22% 74% 0.027% 21% SFP (kg O3 eq) 0.711 0.353 4.63x10⁻² 2.18 0.142 0.137 10.1 0.104 6.99x10⁻² 5.1% 2.5% 0.33% 16% 1% 0.99% 73% 0.75% 0.51% ODP (kg CFC-11 eq) 5.14x10⁻⁷ 6.17x10⁻⁸ 1.40x10⁻⁸ 1.20x10⁻⁷ 3.00x10⁻⁸ 6.87x10⁻⁸ 2.15x10⁻⁶ 1.82x10⁻⁸ 1.08x10⁻⁸ 17% 2.1% 0.47% 4% 1% 2.3% 72% 0.61% 0.36% FFD (MJ surplus) 37.6 7.05 1.58 15.0 2.63 8.44 188 2.07 1.25 14% 2.7% 0.6% 5.7% 1% 3.2% 71% 0.79% 0.47%

Environmental Product Declaration Ecore International | Rubber Flooring ………………………………………………………………………………………………..………………………………………………………………………………………… 35 © 2025 SCSglobalServices.com Table 36. Resource use and waste flows for the flooring products over a 75-yr time horizon. Results reported in MJ are calculated using lower heating values. All values are rounded to three significant digits (PlayGuard - 2.5"/ECOmax 2.5"; High color) Parameter A1 A2 A3 A4 A5 B2 B4 C2 C4 Resources RPRE (MJ) 10.5 0.639 14.0 2.84 0.767 2.28 55.5 0.188 0.193 12% 0.74% 16% 3.3% 0.88% 2.6% 64% 0.22% 0.22% RPRM (MJ) 0.00 0.00 0.00 0.00 0.373 0.00 27.1 0.00 0.00 0% 0% 0% 0% 1.4% 0% 99% 0% 0% NRPRE (MJ) -201 50.2 16.8 114 21.9 65.7 69.4 14.8 9.13 -120% 31% 10% 71% 14% 41% 43% 9.2% 5.7% NRPRM (MJ) 535 0.00 0.00 0.00 3.61x10⁻² 0.00 1,500 0.00 0.00 26% 0% 0% 0% 0.0018% 0% 74% 0% 0% SM (kg) 28.2 0.00 0.00 0.00 1.13 0.00 82.0 0.00 0.00 25% 0% 0% 0% 1% 0% 74% 0% 0% RSF/NRSF (MJ) 0.00 0.00 0.00 0.00 0.00 0.00 0.00 0.00 0.00 RE (MJ) 0.00 0.00 0.00 0.00 0.00 0.00 0.00 0.00 0.00 FW (m3) 1.47 3.83x10⁻² 6.72x10⁻² 0.125 6.93x10⁻² 0.675 5.02 1.13x10⁻² 1.18x10⁻² 20% 0.51% 0.9% 1.7% 0.93% 9% 67% 0.15% 0.16% Wastes HWD (kg) 4.10x10⁻³ 3.25x10⁻⁴ 8.81x10⁻⁵ 7.38x10⁻⁴ 2.19x10⁻⁴ 9.65x10⁻⁴ 1.58x10⁻² 9.56x10⁻⁵ 6.29x10⁻⁵ 18% 1.5% 0.39% 3.3% 0.98% 4.3% 71% 0.43% 0.28% NHWD (kg) 1.18 2.44 2.12 1.70 2.12 0.137 124 0.718 34.1 0.7% 1.4% 1.3% 1% 1.3% 0.081% 74% 0.43% 20% HLRW (kg) 9.63x10⁻⁵ 3.00x10⁻⁶ 1.40x10⁻⁵ 1.14x10⁻⁵ 5.09x10⁻⁶ 9.17x10⁻⁶ 3.69x10⁻⁴ 8.84x10⁻⁷ 8.89x10⁻⁷ 19% 0.59% 2.8% 2.2% 1% 1.8% 72% 0.17% 0.17% ILLRW (kg) 3.40x10⁻⁴ 7.15x10⁻⁶ 5.63x10⁻⁵ 2.81x10⁻⁵ 1.75x10⁻⁵ 2.16x10⁻⁵ 1.27x10⁻³ 2.10x10⁻⁶ 2.13x10⁻⁶ 19% 0.41% 3.2% 1.6% 1% 1.2% 73% 0.12% 0.12% CRU (kg) 0.00 0.00 0.00 0.00 0.00 0.00 0.00 0.00 0.00 MR (kg) 0.00 0.00 0.00 0.00 1.27x10⁻² 0.00 3.55x10⁻² 0.00 0.00 0% 0% 0% 0% 26% 0% 74% 0% 0% MER (kg) 0.00 0.00 0.00 0.00 0.00 0.00 0.00 0.00 0.00 EE (MJ) 0.00 0.00 0.00 0.00 0.00 0.00 0.00 0.00 0.00
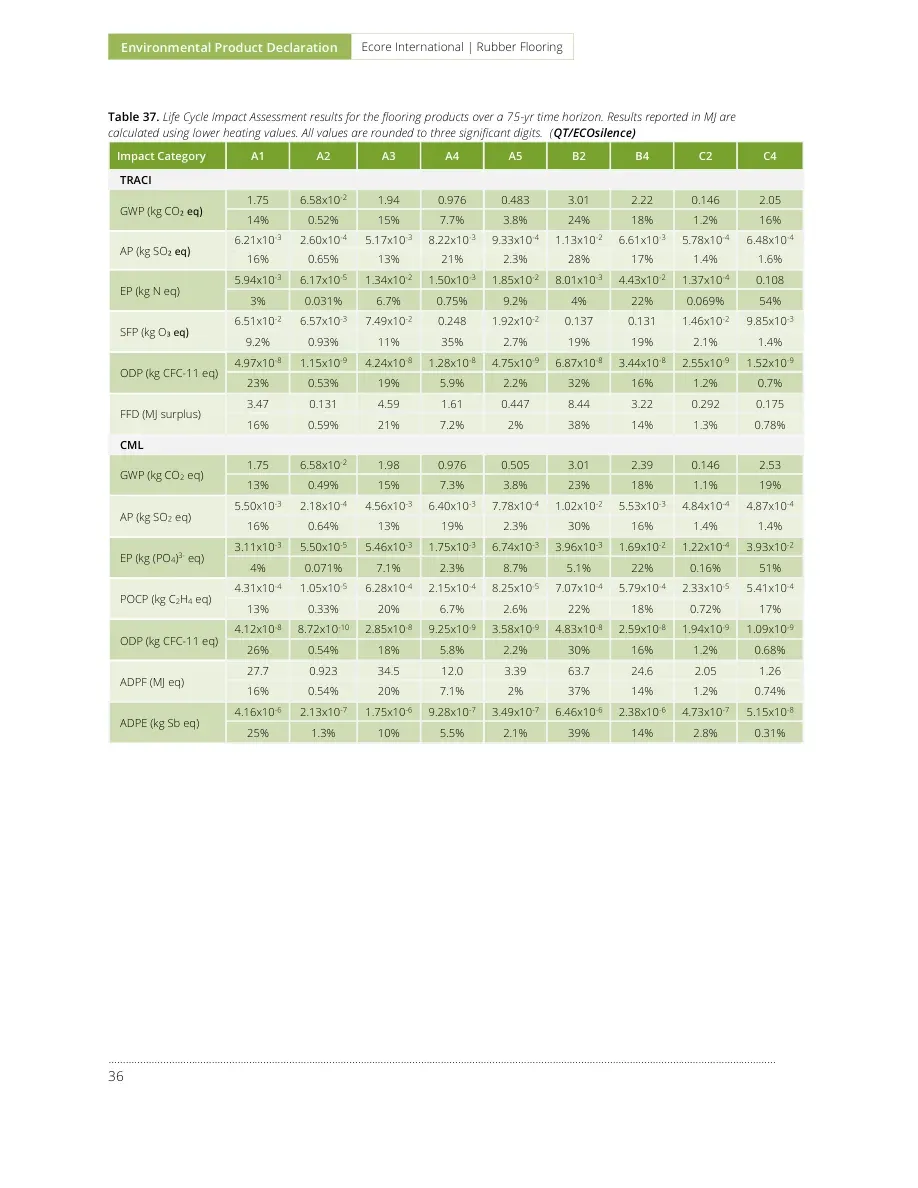
Environmental Product Declaration Ecore International | Rubber Flooring ………………………………………………………………………………………………..…………………………………………………………………………………………………………… 36 Table 37. Life Cycle Impact Assessment results for the flooring products over a 75-yr time horizon. Results reported in MJ are calculated using lower heating values. All values are rounded to three significant digits. (QT/ECOsilence) Impact Category A1 A2 A3 A4 A5 B2 B4 C2 C4 TRACI GWP (kg CO2 eq) 1.75 6.58x10⁻² 1.94 0.976 0.483 3.01 2.22 0.146 2.05 14% 0.52% 15% 7.7% 3.8% 24% 18% 1.2% 16% AP (kg SO2 eq) 6.21x10⁻³ 2.60x10⁻⁴ 5.17x10⁻³ 8.22x10⁻³ 9.33x10⁻⁴ 1.13x10⁻² 6.61x10⁻³ 5.78x10⁻⁴ 6.48x10⁻⁴ 16% 0.65% 13% 21% 2.3% 28% 17% 1.4% 1.6% EP (kg N eq) 5.94x10⁻³ 6.17x10⁻⁵ 1.34x10⁻² 1.50x10⁻³ 1.85x10⁻² 8.01x10⁻³ 4.43x10⁻² 1.37x10⁻⁴ 0.108 3% 0.031% 6.7% 0.75% 9.2% 4% 22% 0.069% 54% SFP (kg O3 eq) 6.51x10⁻² 6.57x10⁻³ 7.49x10⁻² 0.248 1.92x10⁻² 0.137 0.131 1.46x10⁻² 9.85x10⁻³ 9.2% 0.93% 11% 35% 2.7% 19% 19% 2.1% 1.4% ODP (kg CFC-11 eq) 4.97x10⁻⁸ 1.15x10⁻⁹ 4.24x10⁻⁸ 1.28x10⁻⁸ 4.75x10⁻⁹ 6.87x10⁻⁸ 3.44x10⁻⁸ 2.55x10⁻⁹ 1.52x10⁻⁹ 23% 0.53% 19% 5.9% 2.2% 32% 16% 1.2% 0.7% FFD (MJ surplus) 3.47 0.131 4.59 1.61 0.447 8.44 3.22 0.292 0.175 16% 0.59% 21% 7.2% 2% 38% 14% 1.3% 0.78% CML GWP (kg CO2 eq) 1.75 6.58x10⁻² 1.98 0.976 0.505 3.01 2.39 0.146 2.53 13% 0.49% 15% 7.3% 3.8% 23% 18% 1.1% 19% AP (kg SO2 eq) 5.50x10⁻³ 2.18x10⁻⁴ 4.56x10⁻³ 6.40x10⁻³ 7.78x10⁻⁴ 1.02x10⁻² 5.53x10⁻³ 4.84x10⁻⁴ 4.87x10⁻⁴ 16% 0.64% 13% 19% 2.3% 30% 16% 1.4% 1.4% EP (kg (PO4)3- eq) 3.11x10⁻³ 5.50x10⁻⁵ 5.46x10⁻³ 1.75x10⁻³ 6.74x10⁻³ 3.96x10⁻³ 1.69x10⁻² 1.22x10⁻⁴ 3.93x10⁻² 4% 0.071% 7.1% 2.3% 8.7% 5.1% 22% 0.16% 51% POCP (kg C2H4 eq) 4.31x10⁻⁴ 1.05x10⁻⁵ 6.28x10⁻⁴ 2.15x10⁻⁴ 8.25x10⁻⁵ 7.07x10⁻⁴ 5.79x10⁻⁴ 2.33x10⁻⁵ 5.41x10⁻⁴ 13% 0.33% 20% 6.7% 2.6% 22% 18% 0.72% 17% ODP (kg CFC-11 eq) 4.12x10⁻⁸ 8.72x10⁻¹⁰ 2.85x10⁻⁸ 9.25x10⁻⁹ 3.58x10⁻⁹ 4.83x10⁻⁸ 2.59x10⁻⁸ 1.94x10⁻⁹ 1.09x10⁻⁹ 26% 0.54% 18% 5.8% 2.2% 30% 16% 1.2% 0.68% ADPF (MJ eq) 27.7 0.923 34.5 12.0 3.39 63.7 24.6 2.05 1.26 16% 0.54% 20% 7.1% 2% 37% 14% 1.2% 0.74% ADPE (kg Sb eq) 4.16x10⁻⁶ 2.13x10⁻⁷ 1.75x10⁻⁶ 9.28x10⁻⁷ 3.49x10⁻⁷ 6.46x10⁻⁶ 2.38x10⁻⁶ 4.73x10⁻⁷ 5.15x10⁻⁸ 25% 1.3% 10% 5.5% 2.1% 39% 14% 2.8% 0.31%
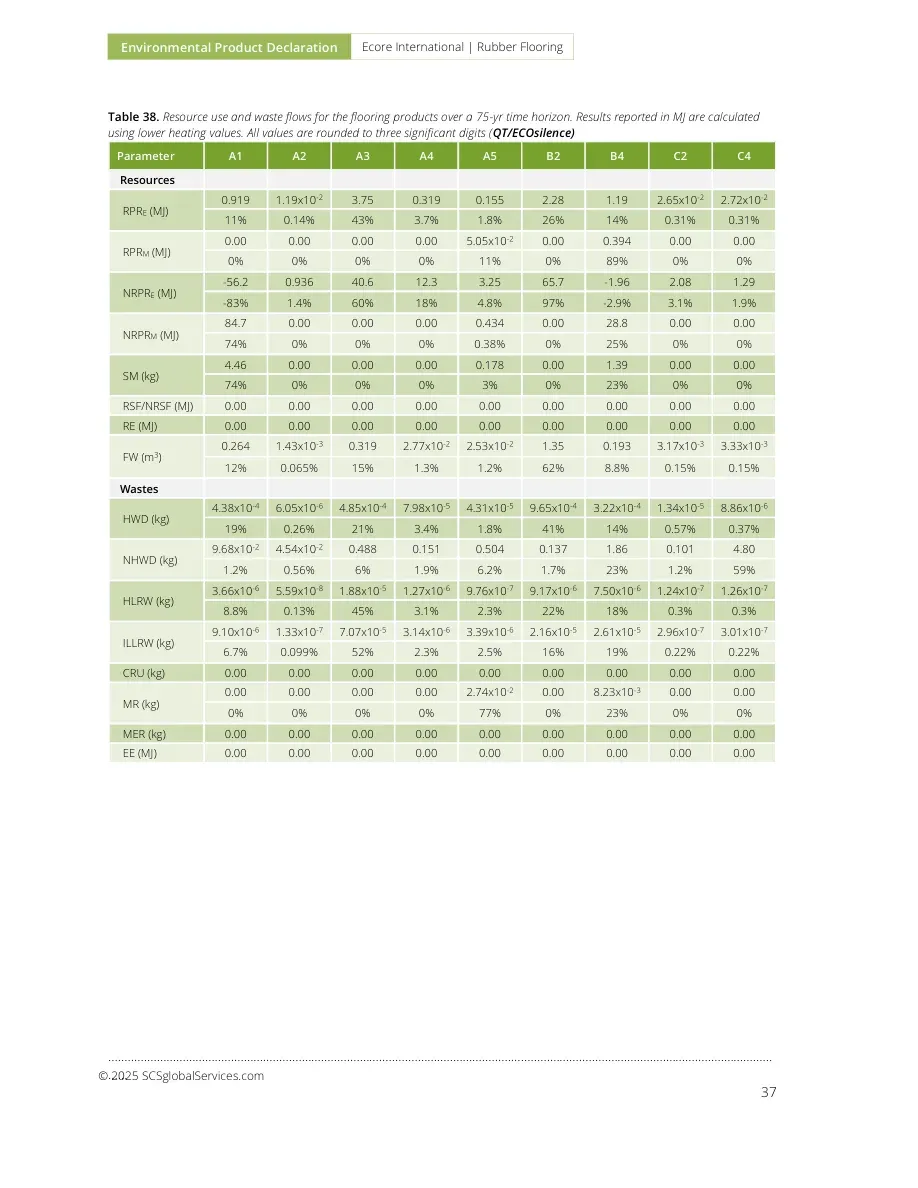
Environmental Product Declaration Ecore International | Rubber Flooring ………………………………………………………………………………………………..………………………………………………………………………………………… 37 © 2025 SCSglobalServices.com Table 38. Resource use and waste flows for the flooring products over a 75-yr time horizon. Results reported in MJ are calculated using lower heating values. All values are rounded to three significant digits (QT/ECOsilence) Parameter A1 A2 A3 A4 A5 B2 B4 C2 C4 Resources RPRE (MJ) 0.919 1.19x10⁻² 3.75 0.319 0.155 2.28 1.19 2.65x10⁻² 2.72x10⁻² 11% 0.14% 43% 3.7% 1.8% 26% 14% 0.31% 0.31% RPRM (MJ) 0.00 0.00 0.00 0.00 5.05x10⁻² 0.00 0.394 0.00 0.00 0% 0% 0% 0% 11% 0% 89% 0% 0% NRPRE (MJ) -56.2 0.936 40.6 12.3 3.25 65.7 -1.96 2.08 1.29 -83% 1.4% 60% 18% 4.8% 97% -2.9% 3.1% 1.9% NRPRM (MJ) 84.7 0.00 0.00 0.00 0.434 0.00 28.8 0.00 0.00 74% 0% 0% 0% 0.38% 0% 25% 0% 0% SM (kg) 4.46 0.00 0.00 0.00 0.178 0.00 1.39 0.00 0.00 74% 0% 0% 0% 3% 0% 23% 0% 0% RSF/NRSF (MJ) 0.00 0.00 0.00 0.00 0.00 0.00 0.00 0.00 0.00 RE (MJ) 0.00 0.00 0.00 0.00 0.00 0.00 0.00 0.00 0.00 FW (m3) 0.264 1.43x10⁻³ 0.319 2.77x10⁻² 2.53x10⁻² 1.35 0.193 3.17x10⁻³ 3.33x10⁻³ 12% 0.065% 15% 1.3% 1.2% 62% 8.8% 0.15% 0.15% Wastes HWD (kg) 4.38x10⁻⁴ 6.05x10⁻⁶ 4.85x10⁻⁴ 7.98x10⁻⁵ 4.31x10⁻⁵ 9.65x10⁻⁴ 3.22x10⁻⁴ 1.34x10⁻⁵ 8.86x10⁻⁶ 19% 0.26% 21% 3.4% 1.8% 41% 14% 0.57% 0.37% NHWD (kg) 9.68x10⁻² 4.54x10⁻² 0.488 0.151 0.504 0.137 1.86 0.101 4.80 1.2% 0.56% 6% 1.9% 6.2% 1.7% 23% 1.2% 59% HLRW (kg) 3.66x10⁻⁶ 5.59x10⁻⁸ 1.88x10⁻⁵ 1.27x10⁻⁶ 9.76x10⁻⁷ 9.17x10⁻⁶ 7.50x10⁻⁶ 1.24x10⁻⁷ 1.26x10⁻⁷ 8.8% 0.13% 45% 3.1% 2.3% 22% 18% 0.3% 0.3% ILLRW (kg) 9.10x10⁻⁶ 1.33x10⁻⁷ 7.07x10⁻⁵ 3.14x10⁻⁶ 3.39x10⁻⁶ 2.16x10⁻⁵ 2.61x10⁻⁵ 2.96x10⁻⁷ 3.01x10⁻⁷ 6.7% 0.099% 52% 2.3% 2.5% 16% 19% 0.22% 0.22% CRU (kg) 0.00 0.00 0.00 0.00 0.00 0.00 0.00 0.00 0.00 MR (kg) 0.00 0.00 0.00 0.00 2.74x10⁻² 0.00 8.23x10⁻³ 0.00 0.00 0% 0% 0% 0% 77% 0% 23% 0% 0% MER (kg) 0.00 0.00 0.00 0.00 0.00 0.00 0.00 0.00 0.00 EE (MJ) 0.00 0.00 0.00 0.00 0.00 0.00 0.00 0.00 0.00

Environmental Product Declaration Ecore International | Rubber Flooring ………………………………………………………………………………………………..…………………………………………………………………………………………………………… 38 Table 39. Life Cycle Impact Assessment results for the flooring products over a 75-yr time horizon. Results reported in MJ are calculated using lower heating values. All values are rounded to three significant digits. (Fit Collection/ECOnights - Low color) Impact Category A1 A2 A3 A4 A5 B2 B4 C2 C4 TRACI GWP (kg CO2 eq) 5.54 2.10 2.06 1.87 0.783 3.01 66.4 0.287 3.95 6.4% 2.4% 2.4% 2.2% 0.91% 3.5% 77% 0.33% 4.6% AP (kg SO2 eq) 1.91x10⁻² 8.32x10⁻³ 4.88x10⁻³ 1.57x10⁻² 2.12x10⁻³ 1.13x10⁻² 0.210 1.13x10⁻³ 1.26x10⁻³ 7% 3% 1.8% 5.7% 0.77% 4.1% 77% 0.41% 0.46% EP (kg N eq) 1.89x10⁻² 1.97x10⁻³ 1.89x10⁻² 2.88x10⁻³ 2.15x10⁻² 8.01x10⁻³ 1.13 2.69x10⁻⁴ 0.217 1.3% 0.14% 1.3% 0.2% 1.5% 0.57% 80% 0.019% 15% SFP (kg O3 eq) 0.198 0.210 7.43x10⁻² 0.474 4.29x10⁻² 0.137 4.19 2.87x10⁻² 1.93x10⁻² 3.7% 3.9% 1.4% 8.8% 0.8% 2.5% 78% 0.53% 0.36% ODP (kg CFC-11 eq) 1.47x10⁻⁷ 3.68x10⁻⁸ 3.48x10⁻⁸ 2.45x10⁻⁸ 1.04x10⁻⁸ 6.87x10⁻⁸ 1.05x10⁻⁶ 5.01x10⁻⁹ 2.98x10⁻⁹ 11% 2.7% 2.5% 1.8% 0.76% 5% 76% 0.36% 0.22% FFD (MJ eq) 10.3 4.20 3.75 3.09 0.932 8.44 92.5 0.572 0.344 8.3% 3.4% 3% 2.5% 0.75% 6.8% 75% 0.46% 0.28% CML GWP (kg CO2 eq) 5.54 2.10 2.13 1.87 0.832 3.01 70.5 0.287 4.86 6.1% 2.3% 2.3% 2.1% 0.91% 3.3% 77% 0.31% 5.3% AP (kg SO2 eq) 1.72x10⁻² 6.97x10⁻³ 4.37x10⁻³ 1.23x10⁻² 1.79x10⁻³ 1.02x10⁻² 0.178 9.50x10⁻⁴ 9.46x10⁻⁴ 7.4% 3% 1.9% 5.3% 0.77% 4.4% 76% 0.41% 0.41% EP (kg (PO4)3- eq) 9.70x10⁻³ 1.76x10⁻³ 7.49x10⁻³ 3.35x10⁻³ 8.02x10⁻³ 3.96x10⁻³ 0.438 2.40x10⁻⁴ 7.89x10⁻² 1.8% 0.32% 1.4% 0.61% 1.5% 0.72% 79% 0.044% 14% POCP (kg C2H4 eq) 1.27x10⁻³ 3.36x10⁻⁴ 4.99x10⁻⁴ 4.11x10⁻⁴ 1.60x10⁻⁴ 7.07x10⁻⁴ 1.50x10⁻² 4.58x10⁻⁵ 1.04x10⁻³ 6.5% 1.7% 2.6% 2.1% 0.82% 3.6% 77% 0.23% 5.3% ODP (kg CFC-11 eq) 1.15x10⁻⁷ 2.79x10⁻⁸ 2.16x10⁻⁸ 1.77x10⁻⁸ 7.85x10⁻⁹ 4.83x10⁻⁸ 7.85x10⁻⁷ 3.80x10⁻⁹ 2.14x10⁻⁹ 11% 2.7% 2.1% 1.7% 0.76% 4.7% 76% 0.37% 0.21% ADPF (MJ eq) 84.2 29.5 29.1 23.0 7.20 63.7 718 4.03 2.46 8.8% 3.1% 3% 2.4% 0.75% 6.6% 75% 0.42% 0.26% ADPE (kg Sb eq) 1.16x10⁻⁵ 6.80x10⁻⁶ 1.45x10⁻⁶ 1.78x10⁻⁶ 9.61x10⁻⁷ 6.46x10⁻⁶ 9.43x10⁻⁵ 9.28x10⁻⁷ 1.01x10⁻⁷ 9.3% 5.5% 1.2% 1.4% 0.77% 5.2% 76% 0.75% 0.081%
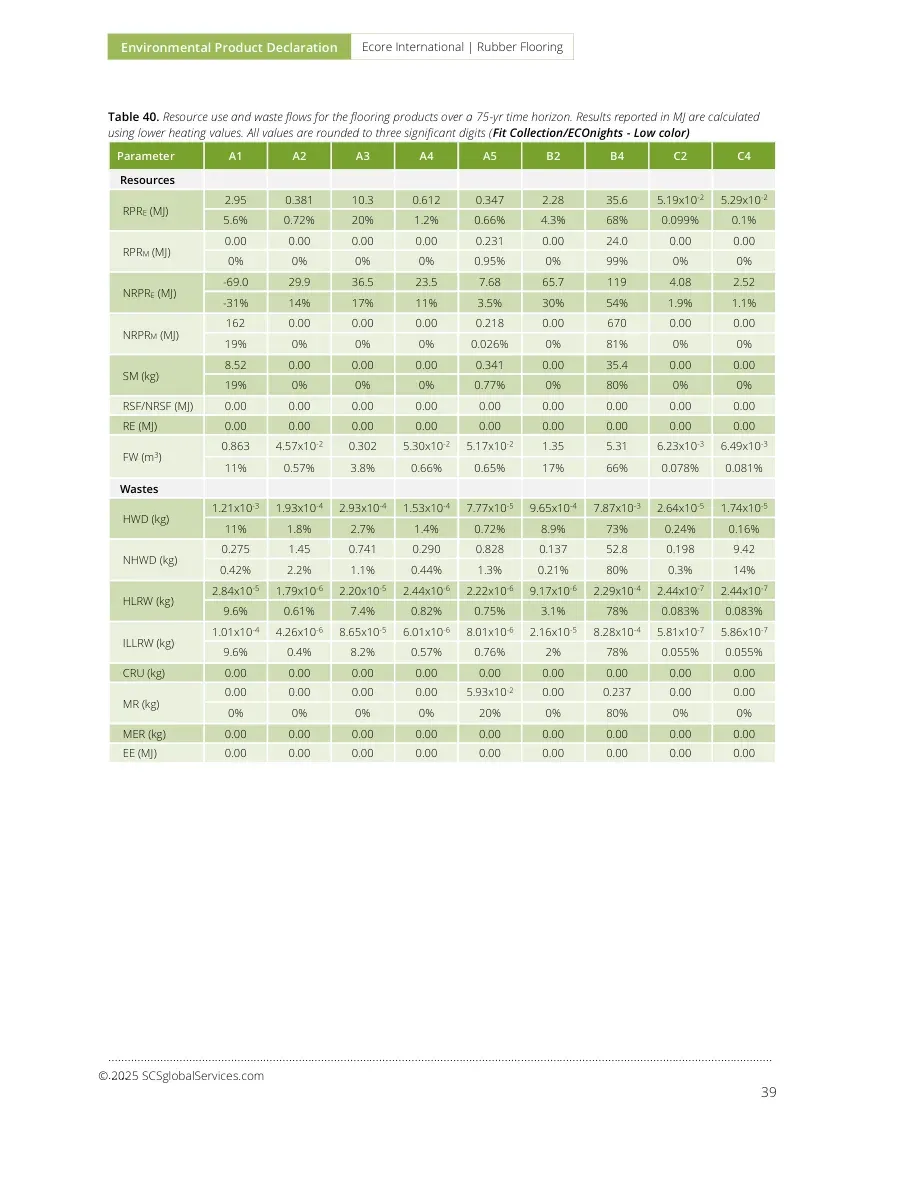
Environmental Product Declaration Ecore International | Rubber Flooring ………………………………………………………………………………………………..………………………………………………………………………………………… 39 © 2025 SCSglobalServices.com Table 40. Resource use and waste flows for the flooring products over a 75-yr time horizon. Results reported in MJ are calculated using lower heating values. All values are rounded to three significant digits (Fit Collection/ECOnights - Low color) Parameter A1 A2 A3 A4 A5 B2 B4 C2 C4 Resources RPRE (MJ) 2.95 0.381 10.3 0.612 0.347 2.28 35.6 5.19x10⁻² 5.29x10⁻² 5.6% 0.72% 20% 1.2% 0.66% 4.3% 68% 0.099% 0.1% RPRM (MJ) 0.00 0.00 0.00 0.00 0.231 0.00 24.0 0.00 0.00 0% 0% 0% 0% 0.95% 0% 99% 0% 0% NRPRE (MJ) -69.0 29.9 36.5 23.5 7.68 65.7 119 4.08 2.52 -31% 14% 17% 11% 3.5% 30% 54% 1.9% 1.1% NRPRM (MJ) 162 0.00 0.00 0.00 0.218 0.00 670 0.00 0.00 19% 0% 0% 0% 0.026% 0% 81% 0% 0% SM (kg) 8.52 0.00 0.00 0.00 0.341 0.00 35.4 0.00 0.00 19% 0% 0% 0% 0.77% 0% 80% 0% 0% RSF/NRSF (MJ) 0.00 0.00 0.00 0.00 0.00 0.00 0.00 0.00 0.00 RE (MJ) 0.00 0.00 0.00 0.00 0.00 0.00 0.00 0.00 0.00 FW (m3) 0.863 4.57x10⁻² 0.302 5.30x10⁻² 5.17x10⁻² 1.35 5.31 6.23x10⁻³ 6.49x10⁻³ 11% 0.57% 3.8% 0.66% 0.65% 17% 66% 0.078% 0.081% Wastes HWD (kg) 1.21x10⁻³ 1.93x10⁻⁴ 2.93x10⁻⁴ 1.53x10⁻⁴ 7.77x10⁻⁵ 9.65x10⁻⁴ 7.87x10⁻³ 2.64x10⁻⁵ 1.74x10⁻⁵ 11% 1.8% 2.7% 1.4% 0.72% 8.9% 73% 0.24% 0.16% NHWD (kg) 0.275 1.45 0.741 0.290 0.828 0.137 52.8 0.198 9.42 0.42% 2.2% 1.1% 0.44% 1.3% 0.21% 80% 0.3% 14% HLRW (kg) 2.84x10⁻⁵ 1.79x10⁻⁶ 2.20x10⁻⁵ 2.44x10⁻⁶ 2.22x10⁻⁶ 9.17x10⁻⁶ 2.29x10⁻⁴ 2.44x10⁻⁷ 2.44x10⁻⁷ 9.6% 0.61% 7.4% 0.82% 0.75% 3.1% 78% 0.083% 0.083% ILLRW (kg) 1.01x10⁻⁴ 4.26x10⁻⁶ 8.65x10⁻⁵ 6.01x10⁻⁶ 8.01x10⁻⁶ 2.16x10⁻⁵ 8.28x10⁻⁴ 5.81x10⁻⁷ 5.86x10⁻⁷ 9.6% 0.4% 8.2% 0.57% 0.76% 2% 78% 0.055% 0.055% CRU (kg) 0.00 0.00 0.00 0.00 0.00 0.00 0.00 0.00 0.00 MR (kg) 0.00 0.00 0.00 0.00 5.93x10⁻² 0.00 0.237 0.00 0.00 0% 0% 0% 0% 20% 0% 80% 0% 0% MER (kg) 0.00 0.00 0.00 0.00 0.00 0.00 0.00 0.00 0.00 EE (MJ) 0.00 0.00 0.00 0.00 0.00 0.00 0.00 0.00 0.00
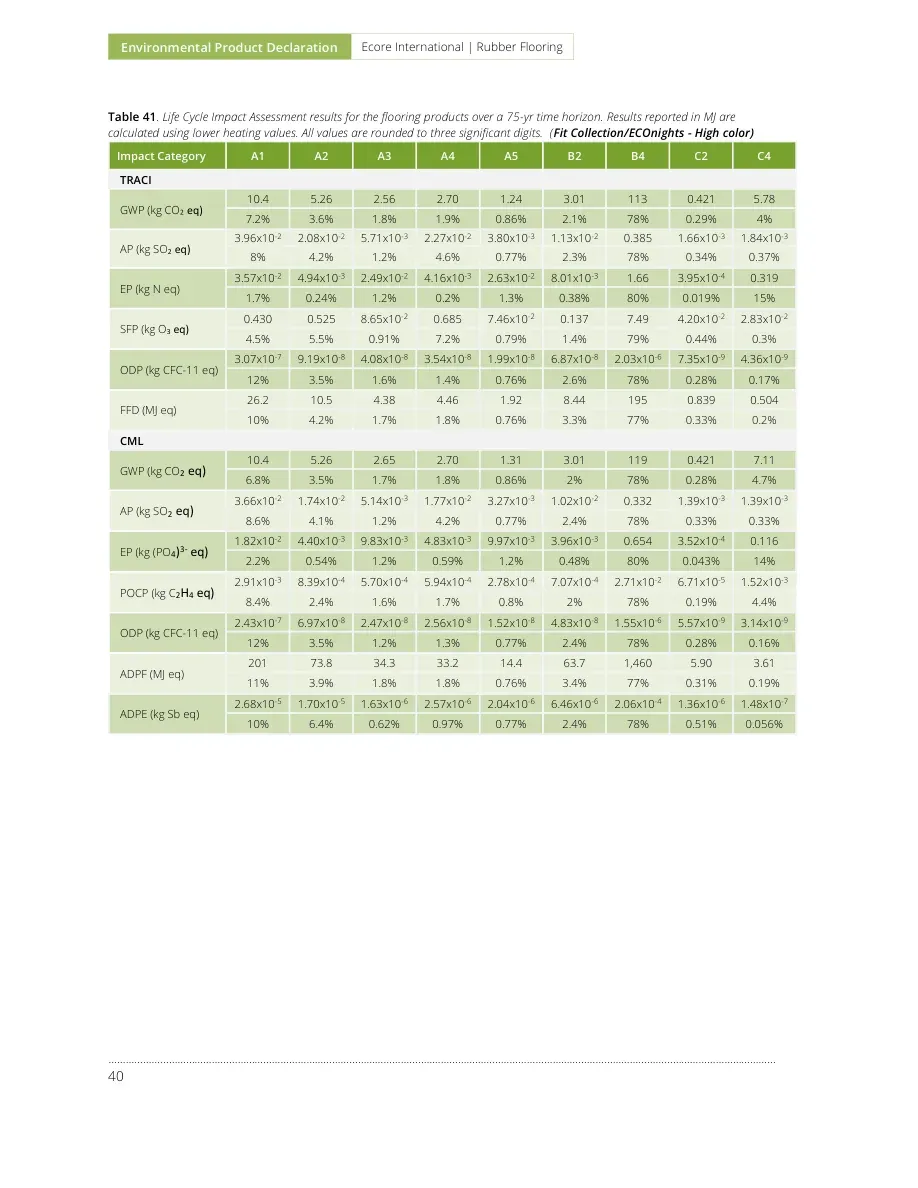
Environmental Product Declaration Ecore International | Rubber Flooring ………………………………………………………………………………………………..…………………………………………………………………………………………………………… 40 Table 41. Life Cycle Impact Assessment results for the flooring products over a 75-yr time horizon. Results reported in MJ are calculated using lower heating values. All values are rounded to three significant digits. (Fit Collection/ECOnights - High color) Impact Category A1 A2 A3 A4 A5 B2 B4 C2 C4 TRACI GWP (kg CO2 eq) 10.4 5.26 2.56 2.70 1.24 3.01 113 0.421 5.78 7.2% 3.6% 1.8% 1.9% 0.86% 2.1% 78% 0.29% 4% AP (kg SO2 eq) 3.96x10⁻² 2.08x10⁻² 5.71x10⁻³ 2.27x10⁻² 3.80x10⁻³ 1.13x10⁻² 0.385 1.66x10⁻³ 1.84x10⁻³ 8% 4.2% 1.2% 4.6% 0.77% 2.3% 78% 0.34% 0.37% EP (kg N eq) 3.57x10⁻² 4.94x10⁻³ 2.49x10⁻² 4.16x10⁻³ 2.63x10⁻² 8.01x10⁻³ 1.66 3.95x10⁻⁴ 0.319 1.7% 0.24% 1.2% 0.2% 1.3% 0.38% 80% 0.019% 15% SFP (kg O3 eq) 0.430 0.525 8.65x10⁻² 0.685 7.46x10⁻² 0.137 7.49 4.20x10⁻² 2.83x10⁻² 4.5% 5.5% 0.91% 7.2% 0.79% 1.4% 79% 0.44% 0.3% ODP (kg CFC-11 eq) 3.07x10⁻⁷ 9.19x10⁻⁸ 4.08x10⁻⁸ 3.54x10⁻⁸ 1.99x10⁻⁸ 6.87x10⁻⁸ 2.03x10⁻⁶ 7.35x10⁻⁹ 4.36x10⁻⁹ 12% 3.5% 1.6% 1.4% 0.76% 2.6% 78% 0.28% 0.17% FFD (MJ eq) 26.2 10.5 4.38 4.46 1.92 8.44 195 0.839 0.504 10% 4.2% 1.7% 1.8% 0.76% 3.3% 77% 0.33% 0.2% CML GWP (kg CO2 eq) 10.4 5.26 2.65 2.70 1.31 3.01 119 0.421 7.11 6.8% 3.5% 1.7% 1.8% 0.86% 2% 78% 0.28% 4.7% AP (kg SO2 eq) 3.66x10⁻² 1.74x10⁻² 5.14x10⁻³ 1.77x10⁻² 3.27x10⁻³ 1.02x10⁻² 0.332 1.39x10⁻³ 1.39x10⁻³ 8.6% 4.1% 1.2% 4.2% 0.77% 2.4% 78% 0.33% 0.33% EP (kg (PO4)3- eq) 1.82x10⁻² 4.40x10⁻³ 9.83x10⁻³ 4.83x10⁻³ 9.97x10⁻³ 3.96x10⁻³ 0.654 3.52x10⁻⁴ 0.116 2.2% 0.54% 1.2% 0.59% 1.2% 0.48% 80% 0.043% 14% POCP (kg C2H4 eq) 2.91x10⁻³ 8.39x10⁻⁴ 5.70x10⁻⁴ 5.94x10⁻⁴ 2.78x10⁻⁴ 7.07x10⁻⁴ 2.71x10⁻² 6.71x10⁻⁵ 1.52x10⁻³ 8.4% 2.4% 1.6% 1.7% 0.8% 2% 78% 0.19% 4.4% ODP (kg CFC-11 eq) 2.43x10⁻⁷ 6.97x10⁻⁸ 2.47x10⁻⁸ 2.56x10⁻⁸ 1.52x10⁻⁸ 4.83x10⁻⁸ 1.55x10⁻⁶ 5.57x10⁻⁹ 3.14x10⁻⁹ 12% 3.5% 1.2% 1.3% 0.77% 2.4% 78% 0.28% 0.16% ADPF (MJ eq) 201 73.8 34.3 33.2 14.4 63.7 1,460 5.90 3.61 11% 3.9% 1.8% 1.8% 0.76% 3.4% 77% 0.31% 0.19% ADPE (kg Sb eq) 2.68x10⁻⁵ 1.70x10⁻⁵ 1.63x10⁻⁶ 2.57x10⁻⁶ 2.04x10⁻⁶ 6.46x10⁻⁶ 2.06x10⁻⁴ 1.36x10⁻⁶ 1.48x10⁻⁷ 10% 6.4% 0.62% 0.97% 0.77% 2.4% 78% 0.51% 0.056%

Environmental Product Declaration Ecore International | Rubber Flooring ………………………………………………………………………………………………..………………………………………………………………………………………… 41 © 2025 SCSglobalServices.com Table 42. Resource use and waste flows for the flooring products over a 75-yr time horizon. Results reported in MJ are calculated using lower heating values. All values are rounded to three significant digits (Fit Collection/ECOnights - High color) Parameter A1 A2 A3 A4 A5 B2 B4 C2 C4 Resources RPRE (MJ) 6.01 0.952 10.8 0.884 0.525 2.28 54.2 7.61x10⁻² 7.75x10⁻² 7.9% 1.3% 14% 1.2% 0.69% 3% 72% 0.1% 0.1% RPRM (MJ) 0.00 0.00 0.00 0.00 0.231 0.00 24.0 0.00 0.00 0% 0% 0% 0% 0.95% 0% 99% 0% 0% NRPRE (MJ) 157 74.8 43.5 34.0 14.9 65.7 1,310 5.98 3.69 9.2% 4.4% 2.5% 2% 0.87% 3.8% 77% 0.35% 0.22% NRPRM (MJ) 51.3 0.00 0.00 0.00 0.218 0.00 228 0.00 0.00 18% 0% 0% 0% 0.078% 0% 82% 0% 0% SM (kg) 2.70 0.00 0.00 0.00 0.108 0.00 11.2 0.00 0.00 19% 0% 0% 0% 0.77% 0% 80% 0% 0% RSF/NRSF (MJ) 0.00 0.00 0.00 0.00 0.00 0.00 0.00 0.00 0.00 RE (MJ) 0.00 0.00 0.00 0.00 0.00 0.00 0.00 0.00 0.00 FW (m3) 1.49 0.114 0.362 7.65x10⁻² 8.32x10⁻² 1.35 8.59 9.13x10⁻³ 9.50x10⁻³ 12% 0.94% 3% 0.63% 0.69% 11% 71% 0.076% 0.079% Wastes HWD (kg) 2.43x10⁻³ 4.84x10⁻⁴ 3.13x10⁻⁴ 2.21x10⁻⁴ 1.43x10⁻⁴ 9.65x10⁻⁴ 1.46x10⁻² 3.87x10⁻⁵ 2.54x10⁻⁵ 13% 2.5% 1.6% 1.1% 0.74% 5% 76% 0.2% 0.13% NHWD (kg) 1.04 3.63 0.986 0.419 1.14 0.137 85.3 0.291 13.8 0.98% 3.4% 0.92% 0.39% 1.1% 0.13% 80% 0.27% 13% HLRW (kg) 2.92x10⁻⁵ 4.47x10⁻⁶ 2.69x10⁻⁵ 3.52x10⁻⁶ 2.61x10⁻⁶ 9.17x10⁻⁶ 2.69x10⁻⁴ 3.58x10⁻⁷ 3.58x10⁻⁷ 8.4% 1.3% 7.8% 1% 0.75% 2.7% 78% 0.1% 0.1% ILLRW (kg) 8.10x10⁻⁵ 1.06x10⁻⁵ 1.07x10⁻⁴ 8.68x10⁻⁶ 8.40x10⁻⁶ 2.16x10⁻⁵ 8.69x10⁻⁴ 8.51x10⁻⁷ 8.57x10⁻⁷ 7.3% 0.96% 9.6% 0.78% 0.76% 2% 78% 0.077% 0.077% CRU (kg) 0.00 0.00 0.00 0.00 0.00 0.00 0.00 0.00 0.00 MR (kg) 0.00 0.00 0.00 0.00 5.93x10⁻² 0.00 0.237 0.00 0.00 0% 0% 0% 0% 20% 0% 80% 0% 0% MER (kg) 0.00 0.00 0.00 0.00 0.00 0.00 0.00 0.00 0.00 EE (MJ) 0.00 0.00 0.00 0.00 0.00 0.00 0.00 0.00 0.00
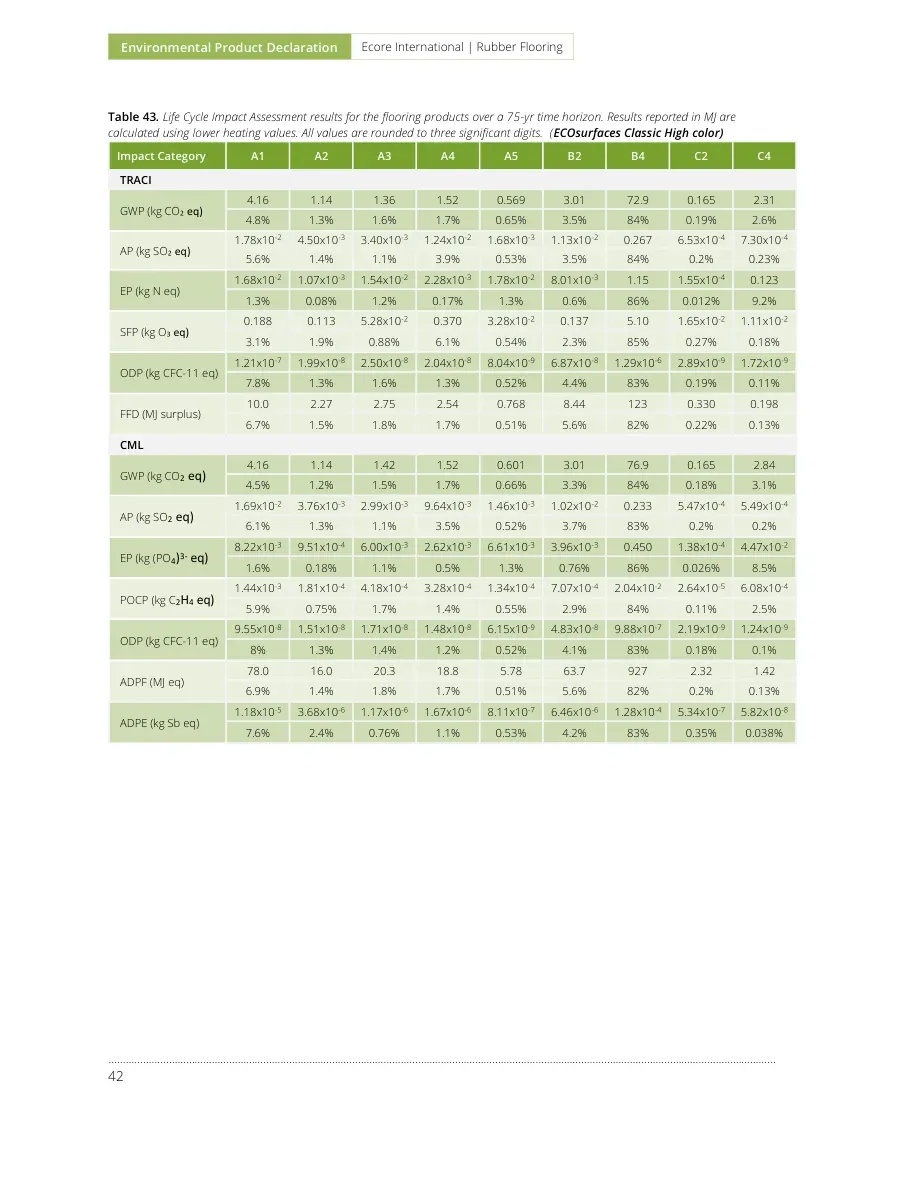
Environmental Product Declaration Ecore International | Rubber Flooring ………………………………………………………………………………………………..…………………………………………………………………………………………………………… 42 Table 43. Life Cycle Impact Assessment results for the flooring products over a 75-yr time horizon. Results reported in MJ are calculated using lower heating values. All values are rounded to three significant digits. (ECOsurfaces Classic High color) Impact Category A1 A2 A3 A4 A5 B2 B4 C2 C4 TRACI GWP (kg CO2 eq) 4.16 1.14 1.36 1.52 0.569 3.01 72.9 0.165 2.31 4.8% 1.3% 1.6% 1.7% 0.65% 3.5% 84% 0.19% 2.6% AP (kg SO2 eq) 1.78x10⁻² 4.50x10⁻³ 3.40x10⁻³ 1.24x10⁻² 1.68x10⁻³ 1.13x10⁻² 0.267 6.53x10⁻⁴ 7.30x10⁻⁴ 5.6% 1.4% 1.1% 3.9% 0.53% 3.5% 84% 0.2% 0.23% EP (kg N eq) 1.68x10⁻² 1.07x10⁻³ 1.54x10⁻² 2.28x10⁻³ 1.78x10⁻² 8.01x10⁻³ 1.15 1.55x10⁻⁴ 0.123 1.3% 0.08% 1.2% 0.17% 1.3% 0.6% 86% 0.012% 9.2% SFP (kg O3 eq) 0.188 0.113 5.28x10⁻² 0.370 3.28x10⁻² 0.137 5.10 1.65x10⁻² 1.11x10⁻² 3.1% 1.9% 0.88% 6.1% 0.54% 2.3% 85% 0.27% 0.18% ODP (kg CFC-11 eq) 1.21x10⁻⁷ 1.99x10⁻⁸ 2.50x10⁻⁸ 2.04x10⁻⁸ 8.04x10⁻⁹ 6.87x10⁻⁸ 1.29x10⁻⁶ 2.89x10⁻⁹ 1.72x10⁻⁹ 7.8% 1.3% 1.6% 1.3% 0.52% 4.4% 83% 0.19% 0.11% FFD (MJ surplus) 10.0 2.27 2.75 2.54 0.768 8.44 123 0.330 0.198 6.7% 1.5% 1.8% 1.7% 0.51% 5.6% 82% 0.22% 0.13% CML GWP (kg CO2 eq) 4.16 1.14 1.42 1.52 0.601 3.01 76.9 0.165 2.84 4.5% 1.2% 1.5% 1.7% 0.66% 3.3% 84% 0.18% 3.1% AP (kg SO2 eq) 1.69x10⁻² 3.76x10⁻³ 2.99x10⁻³ 9.64x10⁻³ 1.46x10⁻³ 1.02x10⁻² 0.233 5.47x10⁻⁴ 5.49x10⁻⁴ 6.1% 1.3% 1.1% 3.5% 0.52% 3.7% 83% 0.2% 0.2% EP (kg (PO4)3- eq) 8.22x10⁻³ 9.51x10⁻⁴ 6.00x10⁻³ 2.62x10⁻³ 6.61x10⁻³ 3.96x10⁻³ 0.450 1.38x10⁻⁴ 4.47x10⁻² 1.6% 0.18% 1.1% 0.5% 1.3% 0.76% 86% 0.026% 8.5% POCP (kg C2H4 eq) 1.44x10⁻³ 1.81x10⁻⁴ 4.18x10⁻⁴ 3.28x10⁻⁴ 1.34x10⁻⁴ 7.07x10⁻⁴ 2.04x10⁻² 2.64x10⁻⁵ 6.08x10⁻⁴ 5.9% 0.75% 1.7% 1.4% 0.55% 2.9% 84% 0.11% 2.5% ODP (kg CFC-11 eq) 9.55x10⁻⁸ 1.51x10⁻⁸ 1.71x10⁻⁸ 1.48x10⁻⁸ 6.15x10⁻⁹ 4.83x10⁻⁸ 9.88x10⁻⁷ 2.19x10⁻⁹ 1.24x10⁻⁹ 8% 1.3% 1.4% 1.2% 0.52% 4.1% 83% 0.18% 0.1% ADPF (MJ eq) 78.0 16.0 20.3 18.8 5.78 63.7 927 2.32 1.42 6.9% 1.4% 1.8% 1.7% 0.51% 5.6% 82% 0.2% 0.13% ADPE (kg Sb eq) 1.18x10⁻⁵ 3.68x10⁻⁶ 1.17x10⁻⁶ 1.67x10⁻⁶ 8.11x10⁻⁷ 6.46x10⁻⁶ 1.28x10⁻⁴ 5.34x10⁻⁷ 5.82x10⁻⁸ 7.6% 2.4% 0.76% 1.1% 0.53% 4.2% 83% 0.35% 0.038%
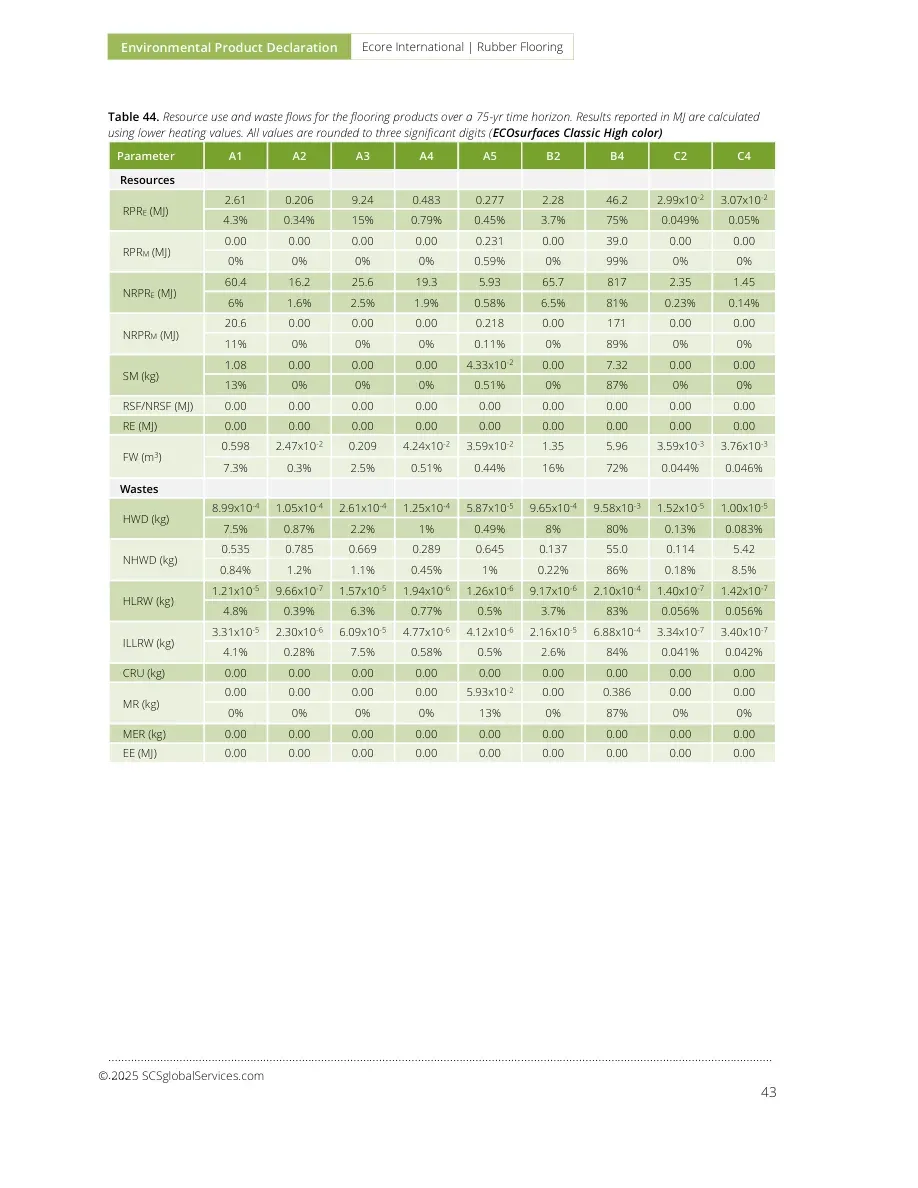
Environmental Product Declaration Ecore International | Rubber Flooring ………………………………………………………………………………………………..………………………………………………………………………………………… 43 © 2025 SCSglobalServices.com Table 44. Resource use and waste flows for the flooring products over a 75-yr time horizon. Results reported in MJ are calculated using lower heating values. All values are rounded to three significant digits (ECOsurfaces Classic High color) Parameter A1 A2 A3 A4 A5 B2 B4 C2 C4 Resources RPRE (MJ) 2.61 0.206 9.24 0.483 0.277 2.28 46.2 2.99x10⁻² 3.07x10⁻² 4.3% 0.34% 15% 0.79% 0.45% 3.7% 75% 0.049% 0.05% RPRM (MJ) 0.00 0.00 0.00 0.00 0.231 0.00 39.0 0.00 0.00 0% 0% 0% 0% 0.59% 0% 99% 0% 0% NRPRE (MJ) 60.4 16.2 25.6 19.3 5.93 65.7 817 2.35 1.45 6% 1.6% 2.5% 1.9% 0.58% 6.5% 81% 0.23% 0.14% NRPRM (MJ) 20.6 0.00 0.00 0.00 0.218 0.00 171 0.00 0.00 11% 0% 0% 0% 0.11% 0% 89% 0% 0% SM (kg) 1.08 0.00 0.00 0.00 4.33x10⁻² 0.00 7.32 0.00 0.00 13% 0% 0% 0% 0.51% 0% 87% 0% 0% RSF/NRSF (MJ) 0.00 0.00 0.00 0.00 0.00 0.00 0.00 0.00 0.00 RE (MJ) 0.00 0.00 0.00 0.00 0.00 0.00 0.00 0.00 0.00 FW (m3) 0.598 2.47x10⁻² 0.209 4.24x10⁻² 3.59x10⁻² 1.35 5.96 3.59x10⁻³ 3.76x10⁻³ 7.3% 0.3% 2.5% 0.51% 0.44% 16% 72% 0.044% 0.046% Wastes HWD (kg) 8.99x10⁻⁴ 1.05x10⁻⁴ 2.61x10⁻⁴ 1.25x10⁻⁴ 5.87x10⁻⁵ 9.65x10⁻⁴ 9.58x10⁻³ 1.52x10⁻⁵ 1.00x10⁻⁵ 7.5% 0.87% 2.2% 1% 0.49% 8% 80% 0.13% 0.083% NHWD (kg) 0.535 0.785 0.669 0.289 0.645 0.137 55.0 0.114 5.42 0.84% 1.2% 1.1% 0.45% 1% 0.22% 86% 0.18% 8.5% HLRW (kg) 1.21x10⁻⁵ 9.66x10⁻⁷ 1.57x10⁻⁵ 1.94x10⁻⁶ 1.26x10⁻⁶ 9.17x10⁻⁶ 2.10x10⁻⁴ 1.40x10⁻⁷ 1.42x10⁻⁷ 4.8% 0.39% 6.3% 0.77% 0.5% 3.7% 83% 0.056% 0.056% ILLRW (kg) 3.31x10⁻⁵ 2.30x10⁻⁶ 6.09x10⁻⁵ 4.77x10⁻⁶ 4.12x10⁻⁶ 2.16x10⁻⁵ 6.88x10⁻⁴ 3.34x10⁻⁷ 3.40x10⁻⁷ 4.1% 0.28% 7.5% 0.58% 0.5% 2.6% 84% 0.041% 0.042% CRU (kg) 0.00 0.00 0.00 0.00 0.00 0.00 0.00 0.00 0.00 MR (kg) 0.00 0.00 0.00 0.00 5.93x10⁻² 0.00 0.386 0.00 0.00 0% 0% 0% 0% 13% 0% 87% 0% 0% MER (kg) 0.00 0.00 0.00 0.00 0.00 0.00 0.00 0.00 0.00 EE (MJ) 0.00 0.00 0.00 0.00 0.00 0.00 0.00 0.00 0.00
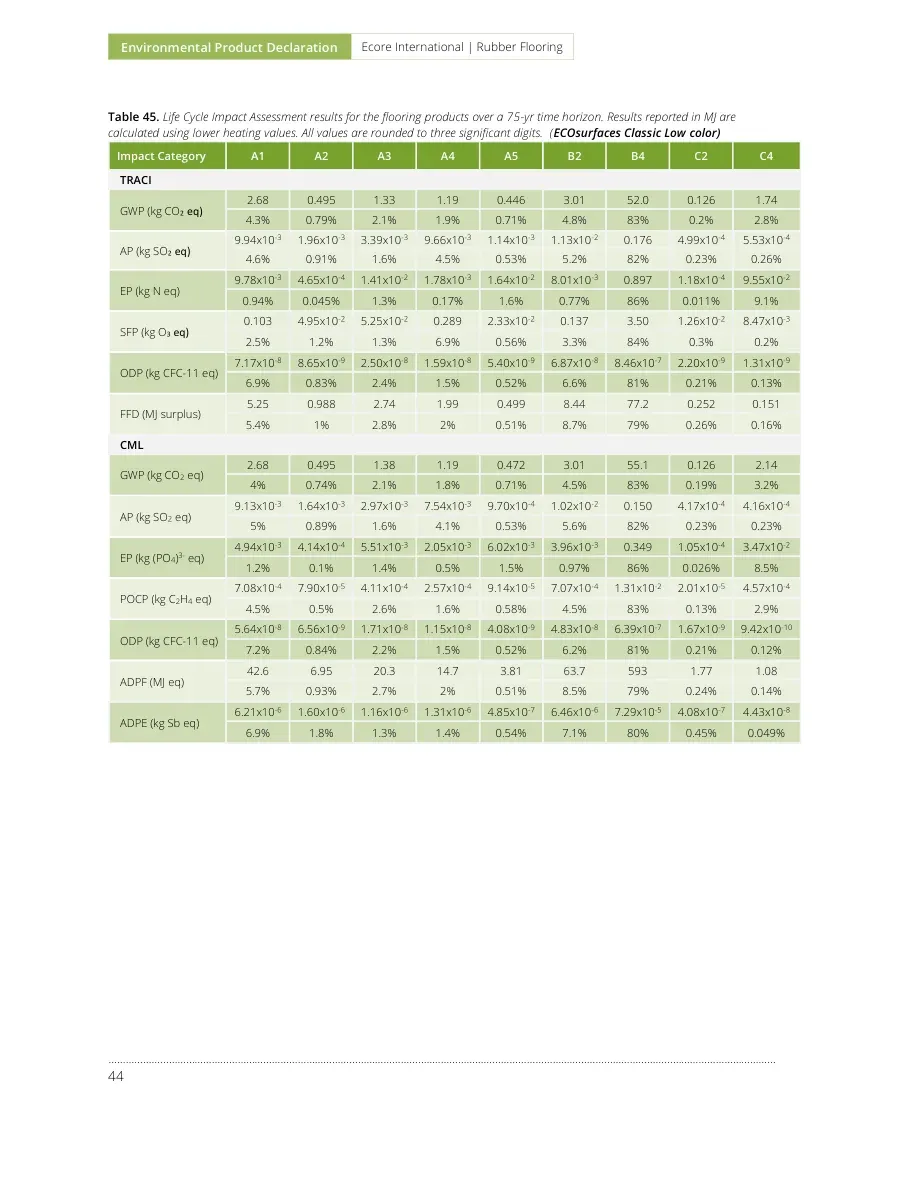
Environmental Product Declaration Ecore International | Rubber Flooring ………………………………………………………………………………………………..…………………………………………………………………………………………………………… 44 Table 45. Life Cycle Impact Assessment results for the flooring products over a 75-yr time horizon. Results reported in MJ are calculated using lower heating values. All values are rounded to three significant digits. (ECOsurfaces Classic Low color) Impact Category A1 A2 A3 A4 A5 B2 B4 C2 C4 TRACI GWP (kg CO2 eq) 2.68 0.495 1.33 1.19 0.446 3.01 52.0 0.126 1.74 4.3% 0.79% 2.1% 1.9% 0.71% 4.8% 83% 0.2% 2.8% AP (kg SO2 eq) 9.94x10⁻³ 1.96x10⁻³ 3.39x10⁻³ 9.66x10⁻³ 1.14x10⁻³ 1.13x10⁻² 0.176 4.99x10⁻⁴ 5.53x10⁻⁴ 4.6% 0.91% 1.6% 4.5% 0.53% 5.2% 82% 0.23% 0.26% EP (kg N eq) 9.78x10⁻³ 4.65x10⁻⁴ 1.41x10⁻² 1.78x10⁻³ 1.64x10⁻² 8.01x10⁻³ 0.897 1.18x10⁻⁴ 9.55x10⁻² 0.94% 0.045% 1.3% 0.17% 1.6% 0.77% 86% 0.011% 9.1% SFP (kg O3 eq) 0.103 4.95x10⁻² 5.25x10⁻² 0.289 2.33x10⁻² 0.137 3.50 1.26x10⁻² 8.47x10⁻³ 2.5% 1.2% 1.3% 6.9% 0.56% 3.3% 84% 0.3% 0.2% ODP (kg CFC-11 eq) 7.17x10⁻⁸ 8.65x10⁻⁹ 2.50x10⁻⁸ 1.59x10⁻⁸ 5.40x10⁻⁹ 6.87x10⁻⁸ 8.46x10⁻⁷ 2.20x10⁻⁹ 1.31x10⁻⁹ 6.9% 0.83% 2.4% 1.5% 0.52% 6.6% 81% 0.21% 0.13% FFD (MJ surplus) 5.25 0.988 2.74 1.99 0.499 8.44 77.2 0.252 0.151 5.4% 1% 2.8% 2% 0.51% 8.7% 79% 0.26% 0.16% CML GWP (kg CO2 eq) 2.68 0.495 1.38 1.19 0.472 3.01 55.1 0.126 2.14 4% 0.74% 2.1% 1.8% 0.71% 4.5% 83% 0.19% 3.2% AP (kg SO2 eq) 9.13x10⁻³ 1.64x10⁻³ 2.97x10⁻³ 7.54x10⁻³ 9.70x10⁻⁴ 1.02x10⁻² 0.150 4.17x10⁻⁴ 4.16x10⁻⁴ 5% 0.89% 1.6% 4.1% 0.53% 5.6% 82% 0.23% 0.23% EP (kg (PO4)3- eq) 4.94x10⁻³ 4.14x10⁻⁴ 5.51x10⁻³ 2.05x10⁻³ 6.02x10⁻³ 3.96x10⁻³ 0.349 1.05x10⁻⁴ 3.47x10⁻² 1.2% 0.1% 1.4% 0.5% 1.5% 0.97% 86% 0.026% 8.5% POCP (kg C2H4 eq) 7.08x10⁻⁴ 7.90x10⁻⁵ 4.11x10⁻⁴ 2.57x10⁻⁴ 9.14x10⁻⁵ 7.07x10⁻⁴ 1.31x10⁻² 2.01x10⁻⁵ 4.57x10⁻⁴ 4.5% 0.5% 2.6% 1.6% 0.58% 4.5% 83% 0.13% 2.9% ODP (kg CFC-11 eq) 5.64x10⁻⁸ 6.56x10⁻⁹ 1.71x10⁻⁸ 1.15x10⁻⁸ 4.08x10⁻⁹ 4.83x10⁻⁸ 6.39x10⁻⁷ 1.67x10⁻⁹ 9.42x10⁻¹⁰ 7.2% 0.84% 2.2% 1.5% 0.52% 6.2% 81% 0.21% 0.12% ADPF (MJ eq) 42.6 6.95 20.3 14.7 3.81 63.7 593 1.77 1.08 5.7% 0.93% 2.7% 2% 0.51% 8.5% 79% 0.24% 0.14% ADPE (kg Sb eq) 6.21x10⁻⁶ 1.60x10⁻⁶ 1.16x10⁻⁶ 1.31x10⁻⁶ 4.85x10⁻⁷ 6.46x10⁻⁶ 7.29x10⁻⁵ 4.08x10⁻⁷ 4.43x10⁻⁸ 6.9% 1.8% 1.3% 1.4% 0.54% 7.1% 80% 0.45% 0.049%

Environmental Product Declaration Ecore International | Rubber Flooring ………………………………………………………………………………………………..………………………………………………………………………………………… 45 © 2025 SCSglobalServices.com Table 46. Resource use and waste flows for the flooring products over a 75-yr time horizon. Results reported in MJ are calculated using lower heating values. All values are rounded to three significant digits (ECOsurfaces Classic Low color) Parameter A1 A2 A3 A4 A5 B2 B4 C2 C4 Resources RPRE (MJ) 1.50 8.97x10⁻² 9.24 0.377 0.224 2.28 37.1 2.28x10⁻² 2.33x10⁻² 3% 0.18% 18% 0.74% 0.44% 4.5% 73% 0.045% 0.046% RPRM (MJ) 0.00 0.00 0.00 0.00 0.231 0.00 39.0 0.00 0.00 0% 0% 0% 0% 0.59% 0% 99% 0% 0% NRPRE (MJ) -13.7 7.05 25.5 15.1 3.97 65.7 230 1.79 1.11 -4.1% 2.1% 7.6% 4.5% 1.2% 19% 68% 0.53% 0.33% NRPRM (MJ) 59.9 0.00 0.00 0.00 0.218 0.00 426 0.00 0.00 12% 0% 0% 0% 0.045% 0% 88% 0% 0% SM (kg) 3.15 0.00 0.00 0.00 0.126 0.00 21.3 0.00 0.00 13% 0% 0% 0% 0.51% 0% 87% 0% 0% RSF/NRSF (MJ) 0.00 0.00 0.00 0.00 0.00 0.00 0.00 0.00 0.00 RE (MJ) 0.00 0.00 0.00 0.00 0.00 0.00 0.00 0.00 0.00 FW (m3) 0.409 1.08x10⁻² 0.209 3.31x10⁻² 2.73x10⁻² 1.35 4.51 2.74x10⁻³ 2.85x10⁻³ 6.2% 0.16% 3.2% 0.51% 0.42% 21% 69% 0.042% 0.043% Wastes HWD (kg) 5.77x10⁻⁴ 4.56x10⁻⁵ 2.61x10⁻⁴ 9.79x10⁻⁵ 4.21x10⁻⁵ 9.65x10⁻⁴ 6.78x10⁻³ 1.16x10⁻⁵ 7.63x10⁻⁶ 6.6% 0.52% 3% 1.1% 0.48% 11% 77% 0.13% 0.087% NHWD (kg) 0.194 0.342 0.603 0.226 0.556 0.137 40.0 8.71x10⁻² 4.14 0.42% 0.74% 1.3% 0.49% 1.2% 0.3% 86% 0.19% 8.9% HLRW (kg) 1.20x10⁻⁵ 4.21x10⁻⁷ 1.57x10⁻⁵ 1.51x10⁻⁶ 1.22x10⁻⁶ 9.17x10⁻⁶ 2.02x10⁻⁴ 1.07x10⁻⁷ 1.07x10⁻⁷ 5% 0.17% 6.5% 0.62% 0.5% 3.8% 83% 0.044% 0.044% ILLRW (kg) 4.10x10⁻⁵ 1.00x10⁻⁶ 6.09x10⁻⁵ 3.73x10⁻⁶ 4.33x10⁻⁶ 2.16x10⁻⁵ 7.25x10⁻⁴ 2.55x10⁻⁷ 2.57x10⁻⁷ 4.8% 0.12% 7.1% 0.43% 0.51% 2.5% 84% 0.03% 0.03% CRU (kg) 0.00 0.00 0.00 0.00 0.00 0.00 0.00 0.00 0.00 MR (kg) 0.00 0.00 0.00 0.00 5.93x10⁻² 0.00 0.386 0.00 0.00 0% 0% 0% 0% 13% 0% 87% 0% 0% MER (kg) 0.00 0.00 0.00 0.00 0.00 0.00 0.00 0.00 0.00 EE (MJ) 0.00 0.00 0.00 0.00 0.00 0.00 0.00 0.00 0.00
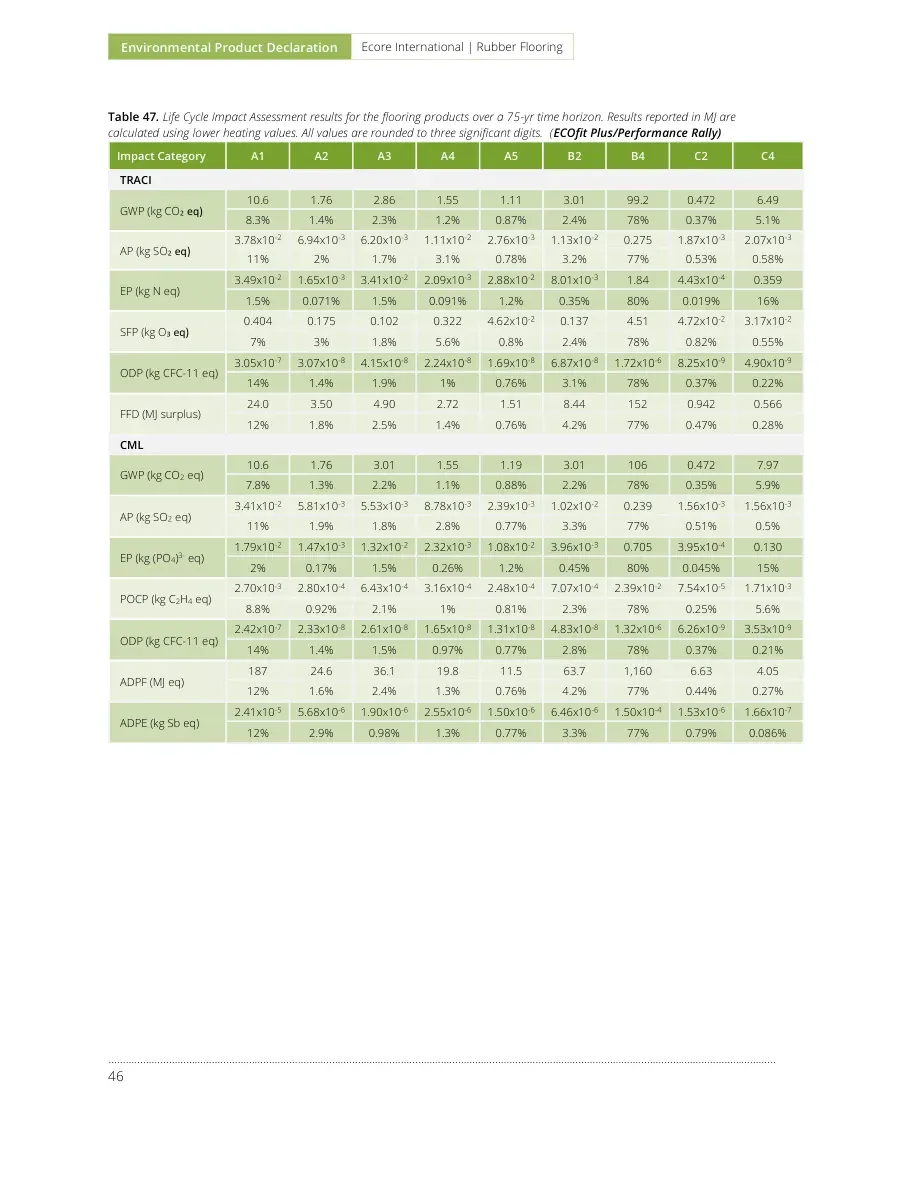
Environmental Product Declaration Ecore International | Rubber Flooring ………………………………………………………………………………………………..…………………………………………………………………………………………………………… 46 Table 47. Life Cycle Impact Assessment results for the flooring products over a 75-yr time horizon. Results reported in MJ are calculated using lower heating values. All values are rounded to three significant digits. (ECOfit Plus/Performance Rally) Impact Category A1 A2 A3 A4 A5 B2 B4 C2 C4 TRACI GWP (kg CO2 eq) 10.6 1.76 2.86 1.55 1.11 3.01 99.2 0.472 6.49 8.3% 1.4% 2.3% 1.2% 0.87% 2.4% 78% 0.37% 5.1% AP (kg SO2 eq) 3.78x10⁻² 6.94x10⁻³ 6.20x10⁻³ 1.11x10⁻² 2.76x10⁻³ 1.13x10⁻² 0.275 1.87x10⁻³ 2.07x10⁻³ 11% 2% 1.7% 3.1% 0.78% 3.2% 77% 0.53% 0.58% EP (kg N eq) 3.49x10⁻² 1.65x10⁻³ 3.41x10⁻² 2.09x10⁻³ 2.88x10⁻² 8.01x10⁻³ 1.84 4.43x10⁻⁴ 0.359 1.5% 0.071% 1.5% 0.091% 1.2% 0.35% 80% 0.019% 16% SFP (kg O3 eq) 0.404 0.175 0.102 0.322 4.62x10⁻² 0.137 4.51 4.72x10⁻² 3.17x10⁻² 7% 3% 1.8% 5.6% 0.8% 2.4% 78% 0.82% 0.55% ODP (kg CFC-11 eq) 3.05x10⁻⁷ 3.07x10⁻⁸ 4.15x10⁻⁸ 2.24x10⁻⁸ 1.69x10⁻⁸ 6.87x10⁻⁸ 1.72x10⁻⁶ 8.25x10⁻⁹ 4.90x10⁻⁹ 14% 1.4% 1.9% 1% 0.76% 3.1% 78% 0.37% 0.22% FFD (MJ surplus) 24.0 3.50 4.90 2.72 1.51 8.44 152 0.942 0.566 12% 1.8% 2.5% 1.4% 0.76% 4.2% 77% 0.47% 0.28% CML GWP (kg CO2 eq) 10.6 1.76 3.01 1.55 1.19 3.01 106 0.472 7.97 7.8% 1.3% 2.2% 1.1% 0.88% 2.2% 78% 0.35% 5.9% AP (kg SO2 eq) 3.41x10⁻² 5.81x10⁻³ 5.53x10⁻³ 8.78x10⁻³ 2.39x10⁻³ 1.02x10⁻² 0.239 1.56x10⁻³ 1.56x10⁻³ 11% 1.9% 1.8% 2.8% 0.77% 3.3% 77% 0.51% 0.5% EP (kg (PO4)3- eq) 1.79x10⁻² 1.47x10⁻³ 1.32x10⁻² 2.32x10⁻³ 1.08x10⁻² 3.96x10⁻³ 0.705 3.95x10⁻⁴ 0.130 2% 0.17% 1.5% 0.26% 1.2% 0.45% 80% 0.045% 15% POCP (kg C2H4 eq) 2.70x10⁻³ 2.80x10⁻⁴ 6.43x10⁻⁴ 3.16x10⁻⁴ 2.48x10⁻⁴ 7.07x10⁻⁴ 2.39x10⁻² 7.54x10⁻⁵ 1.71x10⁻³ 8.8% 0.92% 2.1% 1% 0.81% 2.3% 78% 0.25% 5.6% ODP (kg CFC-11 eq) 2.42x10⁻⁷ 2.33x10⁻⁸ 2.61x10⁻⁸ 1.65x10⁻⁸ 1.31x10⁻⁸ 4.83x10⁻⁸ 1.32x10⁻⁶ 6.26x10⁻⁹ 3.53x10⁻⁹ 14% 1.4% 1.5% 0.97% 0.77% 2.8% 78% 0.37% 0.21% ADPF (MJ eq) 187 24.6 36.1 19.8 11.5 63.7 1,160 6.63 4.05 12% 1.6% 2.4% 1.3% 0.76% 4.2% 77% 0.44% 0.27% ADPE (kg Sb eq) 2.41x10⁻⁵ 5.68x10⁻⁶ 1.90x10⁻⁶ 2.55x10⁻⁶ 1.50x10⁻⁶ 6.46x10⁻⁶ 1.50x10⁻⁴ 1.53x10⁻⁶ 1.66x10⁻⁷ 12% 2.9% 0.98% 1.3% 0.77% 3.3% 77% 0.79% 0.086%
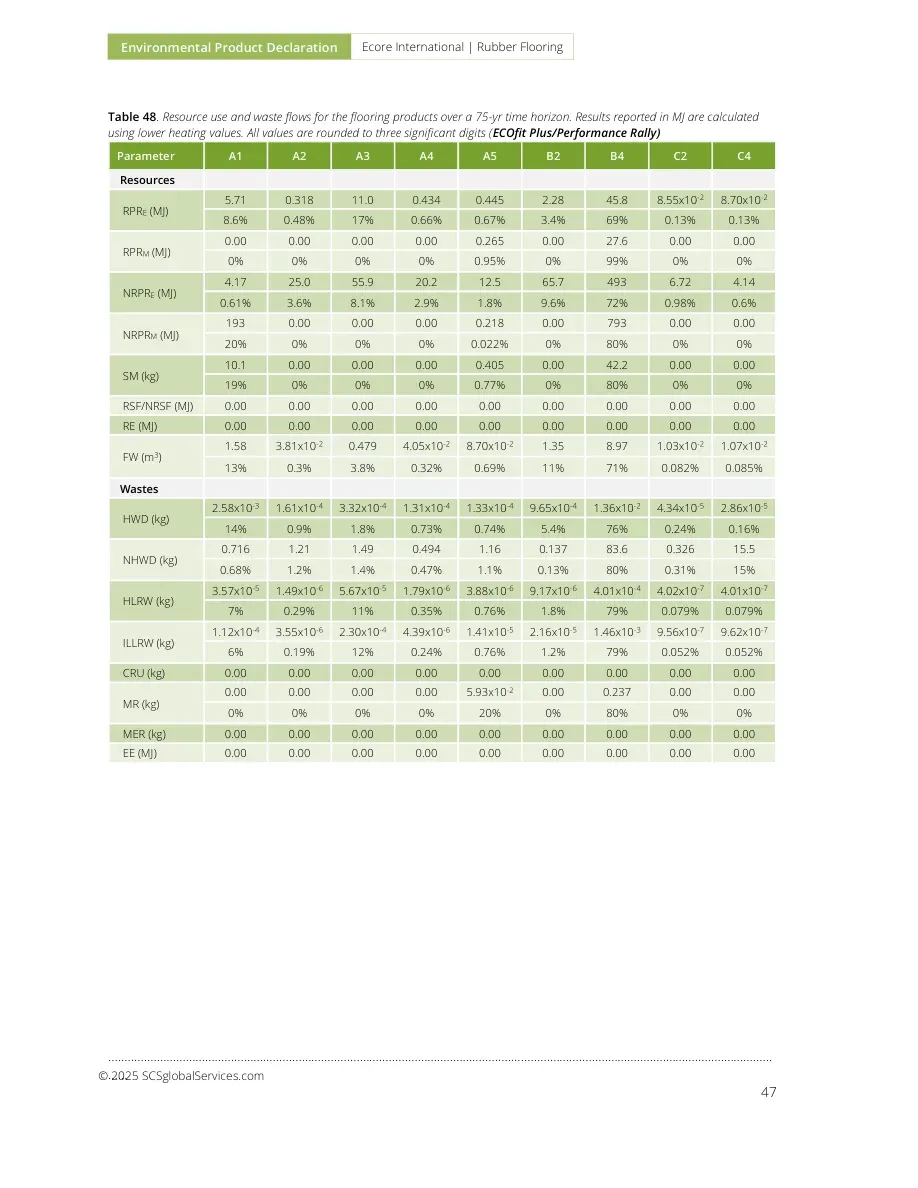
Environmental Product Declaration Ecore International | Rubber Flooring ………………………………………………………………………………………………..………………………………………………………………………………………… 47 © 2025 SCSglobalServices.com Table 48. Resource use and waste flows for the flooring products over a 75-yr time horizon. Results reported in MJ are calculated using lower heating values. All values are rounded to three significant digits (ECOfit Plus/Performance Rally) Parameter A1 A2 A3 A4 A5 B2 B4 C2 C4 Resources RPRE (MJ) 5.71 0.318 11.0 0.434 0.445 2.28 45.8 8.55x10⁻² 8.70x10⁻² 8.6% 0.48% 17% 0.66% 0.67% 3.4% 69% 0.13% 0.13% RPRM (MJ) 0.00 0.00 0.00 0.00 0.265 0.00 27.6 0.00 0.00 0% 0% 0% 0% 0.95% 0% 99% 0% 0% NRPRE (MJ) 4.17 25.0 55.9 20.2 12.5 65.7 493 6.72 4.14 0.61% 3.6% 8.1% 2.9% 1.8% 9.6% 72% 0.98% 0.6% NRPRM (MJ) 193 0.00 0.00 0.00 0.218 0.00 793 0.00 0.00 20% 0% 0% 0% 0.022% 0% 80% 0% 0% SM (kg) 10.1 0.00 0.00 0.00 0.405 0.00 42.2 0.00 0.00 19% 0% 0% 0% 0.77% 0% 80% 0% 0% RSF/NRSF (MJ) 0.00 0.00 0.00 0.00 0.00 0.00 0.00 0.00 0.00 RE (MJ) 0.00 0.00 0.00 0.00 0.00 0.00 0.00 0.00 0.00 FW (m3) 1.58 3.81x10⁻² 0.479 4.05x10⁻² 8.70x10⁻² 1.35 8.97 1.03x10⁻² 1.07x10⁻² 13% 0.3% 3.8% 0.32% 0.69% 11% 71% 0.082% 0.085% Wastes HWD (kg) 2.58x10⁻³ 1.61x10⁻⁴ 3.32x10⁻⁴ 1.31x10⁻⁴ 1.33x10⁻⁴ 9.65x10⁻⁴ 1.36x10⁻² 4.34x10⁻⁵ 2.86x10⁻⁵ 14% 0.9% 1.8% 0.73% 0.74% 5.4% 76% 0.24% 0.16% NHWD (kg) 0.716 1.21 1.49 0.494 1.16 0.137 83.6 0.326 15.5 0.68% 1.2% 1.4% 0.47% 1.1% 0.13% 80% 0.31% 15% HLRW (kg) 3.57x10⁻⁵ 1.49x10⁻⁶ 5.67x10⁻⁵ 1.79x10⁻⁶ 3.88x10⁻⁶ 9.17x10⁻⁶ 4.01x10⁻⁴ 4.02x10⁻⁷ 4.01x10⁻⁷ 7% 0.29% 11% 0.35% 0.76% 1.8% 79% 0.079% 0.079% ILLRW (kg) 1.12x10⁻⁴ 3.55x10⁻⁶ 2.30x10⁻⁴ 4.39x10⁻⁶ 1.41x10⁻⁵ 2.16x10⁻⁵ 1.46x10⁻³ 9.56x10⁻⁷ 9.62x10⁻⁷ 6% 0.19% 12% 0.24% 0.76% 1.2% 79% 0.052% 0.052% CRU (kg) 0.00 0.00 0.00 0.00 0.00 0.00 0.00 0.00 0.00 MR (kg) 0.00 0.00 0.00 0.00 5.93x10⁻² 0.00 0.237 0.00 0.00 0% 0% 0% 0% 20% 0% 80% 0% 0% MER (kg) 0.00 0.00 0.00 0.00 0.00 0.00 0.00 0.00 0.00 EE (MJ) 0.00 0.00 0.00 0.00 0.00 0.00 0.00 0.00 0.00
Environmental Product Declaration Ecore International | Rubber Flooring ………………………………………………………………………………………………..…………………………………………………………………………………………………………… 48 6. LCA: Interpretation The contributions to total impact indicator results are dominated by the product replacement phase (B4) of the assessment. Of the remaining life cycle phases, with the exception of the Eutrophication Potential, the raw material extraction and processing (A1) phase is generally the largest contributor to the overall impacts, followed by product maintenance (B2), upstream transport (A2), product distribution (A4), product disposal (C4), and product manufacturing (A3). The Eutrophication Potential is dominated primarily by the product disposal stage. Other life cycle phase contributions are minimal. 7. Additional Environmental Information 7.1 ENVIRONMENT AND HEALTH DURING MANUFACTURING The Ecore manufacturing facilities are certified to ISO 9001 certified for manufacture and distribution of rubber, cork, and cork/rubber products for non-flooring applications. 7.2 ENVIRONMENT AND HEALTH DURING INSTALLATION The Ecore Rubber flooring products meet the requirements of the CDPH/EHLB Standard Method v1.2-2017 (California Section 01350). 7.3 ENVIRONMENTAL ACTIVITIES AND CERTIFICATIONS Ecore is a member of the U.S. Green Building Council (USGBC), a third-party organization that provides independent oversight of professional credentialing and project certification programs related to green building. Ecore can reclaim your existing rubber flooring and replace it with new Ecore-engineered, high-performance flooring. Your old rubber flooring is recycled into Ecore products that will benefit other facilities in the near future. Together, we ensure that no rubber is wasted, burned, or discarded. For more information regarding Ecore's TRUcircularity program, visit https://www.ecoreintl.com/trucircularity For more information on Ecore’s certifications and environmental initiatives please view the website at https://www.ecoreintl.com.
Environmental Product Declaration Ecore International | Rubber Flooring ………………………………………………………………………………………………..………………………………………………………………………………………… 49 © 2025 SCSglobalServices.com 8. References ▪ Life Cycle Assessment of Ecore International’s Rubber Flooring. SCS Global Services Report. Prepared for client. April 2025. ▪ ISO 14025:2006 Environmental labels and declarations – Type III environmental declarations – Principles and Procedures. ▪ ISO 14040: 2006/Amd 1:2020 Environmental Management – Life cycle assessment – Principles and Framework ▪ ISO 14044: 2006/Amd 1:2017/ Amd 2:2020 Environmental Management – Life cycle assessment – Requirements and Guidelines. ▪ PCR for Building-Related Products and Services - Part A: LCA Calculation Rules and Report Requirements, UL 10010, UL v.4.0, March 2022. ▪ PCR Guidance for Building-Related Products and Services - Flooring EPD Requirements, v.2.0, validity extended to July 1, 2025. ▪ SCS Type III Environmental Declaration Program: Program Operator Manual. V12.0 December 2023. SCS Global Services. ▪ Tool for the Reduction and Assessment of Chemical and Other Environmental Impacts (TRACI). Dr. Bare, J., https://www.epa.gov/chemical-research/tool-reduction-and-assessment-chemicals-and-other-environmental-impacts-traci ▪ CML-IA Characterization Factors. Leiden University, Institute of Environmental Sciences. April 2013. https://www.universiteitleiden.nl/en/research/research-output/science/cml-ia-characterisation-factors ▪ Ecoinvent Centre (2024) ecoinvent data from v3.11. Swiss Center for Life Cycle Inventories, Dübendorf, 2024, http://www.ecoinvent.org ▪ European Joint Research Commission. International Reference Life Cycle Data System handbook. General guide for Life Cycle Assessment – Detailed Guidance. © European Union, 2010.
© 2025 SCSglobalServices.com For more information, contact: Ecore International 715 Fountain Avenue Lancaster, PA 17601 main +717.295.3400 | fax +800.322.1923 | www.ecoreintl.com SCS Global Services 2000 Powell Street, Ste. 600, Emeryville, CA 94608 USA Main +1.510.452.8000 | fax +1.510.452.8001
